Category Archives: Economics

Auto Dealerships Adapt to Reverse Showrooming

Todd Benschneider – University of South Florida
October 7, 2013
Reverse Showrooming Trends Benefit Automobile Dealerships
A current trend in consumer spending known as “showrooming” has deterred many retailers from investing in additional brick and mortar stores. “Showrooming” consumers first visit storefront locations to try on sizes or look at samples; however, those shoppers purchase the goods later through the website or from a lower priced competitor. Long term trends of declining incomes from storefront locations have influenced large chains to reevaluate the return on investment that storefronts will generate in the 21st century. The widespread arrival of mobile technology magnified storefront spending gaps, as many tech savvy consumers now use price comparison apps to reduce the time and fuel spent in pursuit of the lowest prices.

In contrast to showrooming, a new retail trend is emerging as a byproduct of social media; a new breed of reverse showroom shoppers are arriving in stores ready to purchase. In reverse showrooming, a potential customer is exposed first to the new product online by a mention or recommendation from a friend’s social media post, often the posts include price and store location. The recommendation leads the reader to believe that their friend had done the price research for them which prompts the shopper to visit the storefront and make a similar purchase. Research found that while 41% of social media users browse online; they however made the purchases at a store. Further contributing to the growing trend, are recent changes in sales tax laws which eliminate tax savings previously available through online purchases.

Retail automobile sales are an industry uniquely suited to gain from these reverse showrooming trends. Car dealerships have been protected from showrooming behavior; because licensing, financing and insurance regulations require customers to verify proof of identity, sign legal documents and finalize title transfer at brick and mortar franchises. As a result, every internet automobile shopper essentially becomes a reverse showroom buyer.

The internet car shopping experience allows customers to gather comparative information such as fuel economy, safety and reliability ratings without facing the pressure many shoppers can perceive while visiting a dealership showroom to collect brochures and pricing. Buyer’s aversion to interpersonal confrontation may have previously limited automobile sales. In response to customer aversion to dealer showrooms, auto manufacturer websites have responded with new website tools allowing shoppers to build and price each model to exact specifications and locate a match on a dealer’s lot.

Initially many automobile dealerships cursed the arrival of the internet for providing confidential cost information to buyers, which resulted in reduced profit margins. The internet further leveled the playing field by providing buyers a new negotiation tool, email, which allowed consumers to email requests for written proposals in order to create bidding wars among many dealerships. Recently however, dealerships have adapted to this new age of self-service sales, by reducing sales staff, trimming advertising budgets and reducing inventory carrying costs.

Today many dealerships carry lower ratios of stocked inventory per unit sold then in the pre-internet era. This is now possible by capitalizing on website tools that allow customers to effectively imagine what their dream car will look like in combinations of interior and exterior colors, without the need to stock every color combination. The shopping process is further streamlined once the preferred vehicle color and equipment is selected, buyers can simply drive a similarly equipped vehicle at the dealership to test the ride and handling. Once customer selection is confirmed the dealer can transport the exact unit from storage lots within days. To further facilitate the new process, manufacturers have provided assistance to diminished profit margins with generous contributions to dealer compensation through sales quota bonuses.

Many dealerships have survived the arrival of the Web 2.0, those franchises have done so by developing finance and insurance departments that offer cost-effective services that are less effectively shopped through the internet than the car itself. Auto loans, leasing terms, insurance and service contracts have costs dependent on variables such as credit scoring and their vehicle specifics; the combination of these factors become difficult to build accurate proposals in email correspondence, and give dealerships the ability to finalize pricing after the buyer has an escalated level of commitment, which results in greater opportunity to close the deal with higher profit margins. Additionally, increased buyer commitment allows sales managers to focus on the handful of customers present to purchase rather than pinpointing serious buyers from the dozens of casual shoppers browsing from the pre-internet era.

I have watched 15 years of adaptation of the automobile sales process, and see that it would have been difficult to predict shoppers arriving with mobile devices and apps capable of locating specific cars, calculating pricing, estimating trade values and providing interest rates, based on what other buyers obtained on similar vehicles. These customer to customer comparisons are in essence the foundations for what later evolved into social media.

Today, retailers can find ways to make reverse showrooming work to their advantage by utilizing funds available from reduced advertising costs, carrying costs, and labor costs. Armed with these liberated resources retailers can reinvent themselves and create web commerce portals that serve company objectives rather than becoming the idle servants of web demand. We need to prepare a vision to enhance the Web 2.0 tools to our advantage and prepare for a future of unimagined supply chain models made possible through instant mobile spending and speedy shipping options. Survival has always required adaptation, and unlike print media, the automobile industry remains many generations away from the social extinction.

Fitbit, IPO Superstar Struggling for Survival

Todd Benschneider, Qingqi Meng, Jesse Rubin, Lisa Velesko, Xueying Zou

University of South Florida
February 3, 2018

 Company Overview

Fitbit was founded in 2007 in San Francisco, California by James Park and Eric Friedman with a vision to help people lead healthier, more active lives by empowering them with data to reach their fitness goals. Since its founding, Fitbit has become the leading global wearables brand and its products have helped users track and get motivated for everyday health and fitness. Fitbit offers an innovative lineup of popular activity trackers including the Fitbit Surge, Fitbit Blaze, Fitbit Charge 2, Alta HR, Alta, Fitbit Flex 2, Fitbit One and Fitbit Zip, as well as an accessory line featuring the Fitbit Ionic smartwatch, Fitbit Flyer wireless headphones and Fitbit Aria and Fitbit Aria 2 Wi-Fi Smart Scales. Fitbit products are carried in 46,000 retail stores across 78 countries around the globe. Fitbit’s platform delivers personalized experiences, insights, and guidance through leading software and interactive tools. The success of these functionalities has grown the Fitbit social community to over 25 million active users in 2017. The International Data Corporation (IDC) forecasts that the wearables market will nearly double by 2021, leaving the door open for Fitbit to grow and continue its market leading footprint in this category.

Founders

James Park, who serves as the CEO and President of Fitbit, was a Harvard dropout with a computer science background. He was also co-founder of two tech startups, Windup Labs and Epesi Technologies, prior to founding Fitbit. His second startup, Windup Labs, an online photo-sharing company, was acquired by CNET Networks in 2005. James then went on to serve as the director of product development at CNET. James’s diverse background in tech startups also included a stint at Morgan Stanley where he built trading software and developed trading strategies for the bank.

Eric Friedman serves at the CTO of Fitbit. He was a co-founder of both Epesi Technologies and Windup Labs with James Park, and served as an engineer manager at CNET following Windup’s acquisition. Eric earned both his undergraduate and masters degrees in computer science from Yale University.

Neither Park nor Friedman had any manufacturing experience when they came up with the idea to create a wearable product that would change the way people move. They had attended and spoke at the TechCrunch50 conference in 2008, hoping to get 50 preorders. Instead, in one day they received 2,000 pre-orders for the product launching their idea into a true product that had real demand. They had spent several months in Asia looking at suppliers and, according to the founders, nearly crashed and burned seven times (Marshall, 2016). They were already serial entrepreneurs at this point, which gave them an advantage as they traversed the struggles of launching and perfecting a new product.

Financing History

After its founding in 2007, Fitbit went through several rounds of successful seed funding. Funding came primarily from venture capital firms to fund its high growth as an early stage fitness technology company.  The founders were able to raise an initial four hundred- thousand dollars from friends and family to get their idea up and running, but the cash ran out quickly (“Fireside Chat with Fitbit”, 2017). In October 2008, Fitbit closed on its first round of Series A funding, raising $2 million in venture capital from True Ventures, SoftTech VC and several angel investors. This was the company’s first round of institutional funding and the company reportedly met with 40 VCs only to be rejected by all of them (“Fireside Chat with Fitbit”, 2017). Two years later, in September 2010, Fitbit closed a Series B funding round of approximately $9 million. As the company continued to innovate and introduce new products to the market, its need for additional capital also continued. In January 2012, Fitbit raised an additional $12 million in a Series C funding round from its existing investors Foundry Group, True Ventures, SoftTech VC and Felicis Ventures.

A little more than a year later, in September 2013, Fitbit was looking to raise additional capital at a $300 million valuation and secured $43 million in Series D funding from Qualcomm Ventures, Sapphire Ventures and SoftBank Capital, along with its existing shareholders Foundry Group and True Ventures. Only six years after its founding, the company had grown exponentially and raised nearly $66 million in seed capital to fund its operations, innovation and growth and was on its way to going public. Finally, in June 2015, Fitbit completed its Initial Public Offering (IPO) on the New York Stock Exchange at $20 per share, raising $731.5 million in capital. The IPO was comprised of 22,387,500 million new shares offered by Fitbit for a total of $447.75 million in fresh capital for the company and 14,187,500 million shares offered by the selling shareholders. This was the largest ever IPO at the time for a company dedicated to wearable technology. On its first day of trading, the shares of the company popped by 54% and again by 20% on the second day of trading on high demand and trading volume on the NYSE. It is important to note that Fitbit took advantage of the Jumpstart Our Business Startups Act (JOBS Act) of 2012 and registered as an “emerging growth company” (revenues less than $1 billion). This action eased the financial disclosure requirements, thus lowering the cost of going public. Just five months after the IPO closed, Fitbit and its shareholders once again went back to the capital markets and registered a follow-on offering in November 2015.

Unfortunately, market demand for the company’s shares had declined when the follow-on was initiated, which led to the offering being downsized from 7 million to 3 million new shares plus 14 million shares being sold down by current holders. Fitbit was still able to raise $87 million in fresh capital at a $29.00 per share offer price to use for potential acquisitions, working capital and other general corporate purposes, including research and development, sales and marketing activities, general and administrative matters and capital expenditures. Fitbit has not raised any additional equity capital since 2015, but instead has seen its stock price slide to under $6 per share as of January 2018 and its market cap drop from over $6 billion at IPO to under $1.5 billion.

Board of Directors 

Fitbit’s board of directors is comprised of two insider executives and five outside directors. According to Investopedia, the average corporate board size is 9.2 members, so Fitbit may have fewer advisors on its board than its competition. It is important that the founders and company executives surround themselves by intelligent individuals who can help guide the company through its growth and a period of increased competition. Moreover, as the competition in the wearables space increased significantly since the company went public with the introduction of the Apple Watch and other comparable devices, the company will need sound advice for staying competitive. The following table shows the individuals that make up Fitbit’s current board of directors and the important reasoning behind some of their selections as a board member:

Board Member Joined Board Background Reason for Board Selection
James Park Day 1 CEO and President of Fitbit Chairman of the board
Eric Friedman Day 1 CTO of Fitbit Executive Officer of the board
Christopher Paisley January 2015 Executive Professor of Accounting at Santa Clara University. Christopher also sits on the board of 4 corporations in addition to Fitbit Extensive board and operational experience
Laura Alber June 2016 Current President and CEO of Williams-Sonoma Extensive retail industry, merchandising, and operational experience
Jonathan Callaghan September 2008 Founder and Managing Partner of True Ventures Extensive experience with technology companies
Glenda Flanagan June 2016 CFO Whole Foods Market Extensive experience with leading consumer and health-related brands and expertise and background regarding accounting and financial matters
Steven Murray June 2013 Partner at SoftBank Capital Extensive experience with technology companies


FITBIT’S GROWTH CURVE 

Fitbit’s formation in 2007 was inspired by the fitness potential of the 2006 release of the Nintendo Wii. Park theorized that exercise data could be harvested from the Wii game sessions and the resulting feedback metrics would create friendly competition among friends on metrics for health and fitness accomplishments, capitalizing on the social appeal of video game scoring. At eighteen months, the company had released its first fully functional prototype: the Fitbit tracker, which took second place at the 2008 TechCrunch50 conference. Because of the publicity of Fitbit’s second place finish among a field of respectable competition, the young company received a surprising 2,000 preorders for the $99 clip-on device. With those pre-orders, a successful track record from previous ventures and that technology award, Fitbit had gained enough credibility to attract a variety of venture capitalists (Marshall, 2016). 

The first $2 million in venture capital came within two months of the TechCrunch50 publicity allowing the founders to quickly select a production location in Singapore and contract a manufacturer to build the devices. Their initial prototype, a simple pen sized pod which collected motion activity through a gyroscopic sensor like the one found in a Nintendo Wii controller, contained an integrated Bluetooth transmitter and onboard memory. Park was confident this simple design would prove easy enough to mass produce. However, the design and arrangement of the components did not translate well into mass production, causing several complete redesigns before Fitbit had a product that was compatible with an assembly line manufacturer.

Despite promises that the 2,000 preorders would be filled by December 2008, the deadline proved impossible to meet and the first Fitbit’s did not ship until September 2009, nearly two and a half years after the company’s formation and nine months behind schedule. In the remaining months of 2009, 5,000 additional units were sold. In the first year of distribution, reports of software accuracy problems surfaced, several exercise researchers found that Fitbits activity algorithms greatly overestimated the calorie burn rates, resulting in low levels of weight loss success among Fitbits earliest customers. (Koch, 2016).

Core Vertical Operations 

Fitbit’s original business model disrupted a market of more sophisticated fitness devices, such as heart rate monitors from Polar, Garmin and Magellan. The fitness market of 2007 was served by complex sports watch and chest strap combinations, together they measured exercise intensity and estimated the calories burned by monitoring the electronic signals of heart rate and broadcasting the readings to a sport watch for data storage, then were uploaded by a micro USB cord to a PC for processing and storage. The technology in those heart rate monitors was evolving in 2009 as the Fitbit finally arrived on store shelves, with competing fitness trackers offering more precise GPS features to record distances traveled during exercise. Those emerging sports watches combined the distance data along with a user’s height and weight data and the resulting heart rate to provide workout intensity information and more precise calorie burn estimates (Koch, 2016).

The disadvantages of the heart rate monitor technology of Fitbit’s competitors was that the device sensors required a wide elastic belt to be worn around the chest, which many users found awkward and uncomfortable and regardless of how well these transmitters fit, they often lost signal during exercises involving twisting motions (Kerner, 2017).  Fitbit’s one-piece solution simplified calorie burn estimates by utilizing pre-calculated burn rates based on physical motion, factoring in the wearer’s weight and age, which was surprisingly accurate at estimating calorie burn rates almost as precisely as the more sophisticated heart rate system. It is through this minimalistic hardware and multi-day battery life combined with sophisticated software that Fitbit chose to build their first vertical.

A third area of Fitbits design advantage was its freedom from GPS and cellular connections, the competitors in the heart rate and GPS systems were only marginally accurate at measuring distances, and in doing so they consumed considerable battery power; in addition, most the competing GPS watches required an overnight recharge for every three hours of activity monitoring. The amount of hardware and sophisticated technology in Fitbits competitors also added to the costs with a 2008 price range of between $300 and $800 per device. The combination of awkward chest straps, inconvenient recharging times and high price limited the market appeal of those original GPS fitness trackers to serious athletes and extremely health conscious consumers (Seitz, 2016).

Fitbit’s superior solution simplified fitness trackers, because the designers realized that heart rate and distance were not an absolute requirement to estimate calorie burn for casual exercises. Fitbit’s proprietary technology used a more energy efficient pedometer that detected motions generated by walking and combined that multi-sport motion sensing technology. The Fitbit software could decode the detected movements and estimate what type of exercise was being performed, and estimate the number of calories being used, the wristbands were capable of storing days’ worth of data to later be uploaded to their website for analysis and initial studies found that Fitbit’s projected calorie burn was nearly as accurate at calculating the calorie conversions made by more sophisticated hardware used by Garmin and Polar (Huang, 2016).

In comparison, Fitbit’s simplified wristband motion trackers could also easily be worn around the clock to provide a more comprehensive overview of total activity, including sleep data. The system’s energy efficiency allowed the wristbands to last up to five days between charges and the accompanying fast-chargers could recharge the Fitbit in less than an hour. The comfort and convenience of this revolutionary design combined with the simple technology allowed the devices to sell for a fraction of the price of existing fitness monitors. Fitbit’s original business model also planned for an additional revenue stream created by premium website services such as long-term data storage, charts and analysis for an annual subscription cost of $50, this plan would allow sustainable income after market saturation was eventually reached. All of these competitive advantages created a new vertical product in the health and fitness technology market and Fitbit was the first name that any consumer thought of if considering an inexpensive and simple calorie and exercise tracker (Koch, 2016).

Building substantial height to its core vertical, Fitbit pioneered a corporate wellness sales division, a move that has kept the company ahead of its competitors in the workplace wellness marketplace. These partnership’s competitive advantages have been sustained by Fitbit’s unique customization of user data to comply with the recently passed Health Insurance Patient Privacy Act-HIPPA (Seitz, 2015).

Unmet Market Need Aim & Missed Opportunities

Today, Fitbit continues to face tough competition from the Apple Watch and new fitness technology that offers precision level EKG quality heart rate hardware. Apple was quick to acquire the company who created this technology, with hopes of integrating it into a new market of heart conscious consumers. The future possibilities for the Apple Watch include sending 911 notifications if the user’s heartbeat stops or sending an alert to a user when one’s pulse indicates a warning of an oncoming heart attack. The technology could also prove valuable in solving crimes by alerting authorities the precise time and location of a murder or fatal accident. If Apple pioneers such lifesaving technology in an affordable package with a multitude of companion features, it would be safe to assume a dimmer forecast for Fitbit’s market niche (Feel the Beat of Heart Rate Training, 2017).

Competitive Advantage 

Fitbit’s key early advantage was being the first wearable fitness tracker to market. James Park seized the opportunity to address the unmet market need, developing the first few models that set the bar across the market and Fitbit soon became a household name. The simplicity of the initial out of the box setup and continuous wear and convenience made Fitbit the device of choice with consumers looking for daily encouragement to reach personal health and fitness goals.

With over 25 million current Fitbit active users, Fitbit’s community has become the largest activity tracking population. New consumers are also attracted to join the Fitbit community to chat and challenge brand-loyal friends. Maintaining an active online community has been essential for Fitbit’s most recent technical developments. The more people who track their fitness, find opportunities for improvement and provide feedback, the better the next generation product can be. However, it didn’t take long for tech industry giants to catch up and surpass a device, which was once only a pedometer, with their own patented technology (Entis, 2017).

Today, Fitbit’s greatest advantage is its affordable price. Consumers can purchase a new Fitbit for only $100 compared to the lowest grade of the Garmin watch, the Forerunner, which costs $105 and the original Apple Watch priced at $179. This advantage will continue to attract people interested in tracking their health who don’t want to break the bank on GPS satellite accuracy and smartphone compatibility. As Fitbit adds new features to its product set, as done with its newest model, the Ionic, the price gap is slowly closing and the entrance of $25 rivals from several Chinese manufacturers is squeezing the profits in the market (Lashinsky, 2016).

An additional threat to Fitbit’s future growth is the entry of conventional watch companies such as Timex and Casio offering less expensive $30 competitors in addition to luxury brands such as Tag Heuer, Seiko and Ferragamo that offer integrated activity tracking sensors into conventional jewelry timepieces. The entry of the conventional watchmakers eliminated one common complaint of prospective Fitbit buyers, since many users do not choose to wear a simple rubber wristband in place of or in addition to a conventional watch (Seitz, 2016).

Unique Products and Services that Create Barriers to Entry from Competitors 

Fitbit has been able to defend its position as a market leader through its design simplicity. No competitor has managed to offer novice fitness consumers a smoother transition to integrate a tracking device into their daily routines. The loyalty of Fitbit’s existing customers is reinforced by the storage of historical weight and fitness history through the supporting website and phone applications. If a current user switched brands, they would lose the integration of historical charts and graphs comparing current fitness progress to their own previous levels. Additionally, Fitbit has captured the first mover advantage in corporate wellness programs and has maintained that position through a well-developed Health Information Privacy Law department that protects its corporate clients from employee lawsuits. The base model Fitbit’s simplicity also provides competitive advantages in the corporate wellness market, since its lacks GPS and heart-rate capabilities which eases employee fears of health condition discrimination or inappropriate employee location tracking (Farr, 2016).

Home Office and Distribution

Headquartered in San Francisco, California, the company has expanded its distribution around the world after nearly a decade of development. In addition to North America, Fitbit has a presence in Latin America, Europe, the Middle East, Africa and Asia Pacific with offices in large cities including Boston, Dublin, Hong Kong, Shanghai, Seoul, Tokyo, New Delhi and Singapore.

But how does Fitbit expand markets and sell their products in other regions? Take China as an example. Fitbit formally entered the Chinese market in June 2014, following its sales footprint in 42 countries around the world. But why did Fitbit choose to enter the Chinese market in 2014? Fitbit studied the research reports on the health status of Chinese consumers.

In fact, the future health of the Chinese people deserved attention. China’s overweight population has risen from 25% in 2002 to 38% in 2012 and this number reached 50% by 2015. In terms of body fat index, on average, Chinese are not as overweight as Westerners, but the incidence of diabetes in Chinese people is as high as 11%, similar to that of the United States. Furthermore, people categorized as obese now accounts for 11% of the total population. Fitbit can help Chinese consumers become healthier, because it has a lot of measurement functions, such as the number of steps walked, steps climbed, heart rate, quality of sleep, and other personal needs involved in fitness. Fitbit’s products function for sports, diet, sleep and weight management and include peripheral systems to help people build healthier lives (Koch, 2016).

In terms of sales channels, Fitbit understands that online sales in China are very important. Following Best Buy, which uses Jing Dong is its online distributor, Fitbit products have started distribution with Jing Dong.

In addition, Fitbit’s products are now manufactured in Shenzhen, China, an area that is quickly becoming the technology manufacturing region of the 21st century (Entis, 2017). Fitbit also opened a flagship store in Tian Mall. Additionally, conventional distribution channels such as Amazon, sporting goods stores and most large department store chains all carry Fitbit products. The primary mission of the Chinese team is to broaden Fitbit’s brand awareness so that everyone knows what Fitbit is, how it helps people live a healthier and happier life.

Diversity 

Unlike the wide array of applications, functionality and color provided by their wearable trackers, Fitbit is guilty of lacking diversity in the workplace. Like many tech software companies, Fitbit perpetuated a serious gender imbalance in favor of men. The firm took memorable heat from the press in 2015, as their all male Board of Directors generated attention. Even though women dominate the wearable activity tracker consumer base, Fitbit didn’t see it necessary to include females on their board or in leadership positions. The media isn’t the only source reporting misrepresentation. There is a clear consensus among employee reviews on job sites like Glassdoor and Indeed that expose the company as “extremely white-washed” with very little opportunity for growth for minorities that manage to make it in the door. Unfortunately, lack of gender and cultural representation is an all too popular trend in STEM industries and tech software companies in particular.

Recently, Fitbit has made notable strides to diversify its workforce. Two women have succeeded retired board members, while two more have moved up into Vice President roles. As for the inclusion of minorities, Fitbit has yet to demonstrate progress toward their promise to attain an ethnically proportionate workforce. We are hopeful that the firm’s welcome to fair hiring is genuine and Fitbit can create a more inclusive company and culture.

Sustainability 

Today’s most successful new companies clearly published policies and strategies to achieve the Triple Bottom Line results. Like their stances on diversity and global responsibility, Fitbit’s formal policies on sustainable business practices are also non-existent. We can conceive the attention extended to healthcare and fitness, but what about the well-being of the environment? From what we can gather on Fitbit’s consumer output, their products are relatively easy to recycle. Once users decide to give up a wearable tracker or upgrade to the newest version, they can either sell or donate the device. But soon, these old technologies will become obsolete. Their capabilities will prove to be outdated and inaccurate, rendering the whole device useless. In the case that the bracelets are not in reusable condition, there is no solution to keep them from piling up in landfills.

This is where a true opportunity lies for Fitbit. Like the Apple take back system, Fitbit can receive old devices at their end of their life to disassemble into separate, reusable parts. Though this prove an initial cost for Fitbit, they can deliver a new sustainability platform to their consumers and save on usable electronic parts in the long-term. 

Competitor

  • Apple Watch

Fitbit Ionic vs Apple Watch Series 3: Design

There’s no doubt that the Fitbit Ionic lacks a conventional aesthetic appeal; however, it won’t burn your eyes off. Recently Fitbit has been focusing on integrating style into their designs. The Ionic contrastes the Blaze’s angular look, and while we found it grew on us during testing, it’s sure to put a lot of people off.

On the other hand, the Ionic is impressive in how it crams a whole bunch of technology into a slim, lightweight case. You’ve got GPS, NFC, enough battery for four days of life and multiple sensors in a 50m waterproof square. Like the Blaze, there are three buttons on display here. You can use the display to touch your way around Fitbit OS, but if your hands are wet or if you’re in the water you may have an easier way around with some tactility.

With excellent clarity in both low light and glaring sunshine. You’ll get the Ionic in three flavors: a silver watch case with a blue/grey band, a graphite grey case with a charcoal band and a “blue orange” case with a slate blue band. But in case you’re not down with stock bands, you’ll also be able to purchase some nice accessories. There are two-toned breathable sport bands for purchase in three colorways as well as handcrafted Horween leather bands in midnight blue and cognac.

However, Apple watch keeps a design that’s nearly three years old, but the watch is easier on the eyes. Take apple watch series 3 as an example, it stills provide several models to users to choose. There are two different case sizes (38mm and 42mm), three different materials (aluminum, stainless steel and ceramic) and a whole lot of different colors. With the Series 3, you can get the LTE in the whole range, but non-LTE only comes in aluminum. There are also endless band options, from the low-end nylon and sport bands to high-end Milanese Loops and leather bands.

The major differentiator between these two is in the build. If you’re looking for something to complement every outfit in your wardrobe, and you have no problem with collecting an army of bands, the Apple Watch wins. Apple watch offers very limited styles for users to select, if people who want to have different styles smartwatch, Fitbit absolutely a better choice.

Fitbit Ionic vs Apple Watch Series 2: Battery

For as long as the Apple Watch has been around, it’s gotten about a day of battery life. Sometimes it’ll do less, but most of the time you get about a day – a day and a half to two days if you make deliberate efforts to avoid high consumption apps. With a mixture of both LTE and non-LTE features in the Series 3, you should still get around that, but using the call feature will cut it dramatically. In fact, Apple quotes only an hour of continuous talk time on the Watch.

The Ionic, Fitbit, will net people up to five days of battery life, or up to 10 hours when using GPS or playing music. That’s decent from such a slim device with as much power and many features as it has. If you have to make your decision based on battery life, the Fitbit is the clear winner here. Those extra days mean it’s much more viable as a sleep tracker too.

Fitbit Ionic vs Apple Watch Series 3: Price

The Apple Watch Series 3 has a wide range of prices, starting as low as $329 without LTE, $399 with the cellular connection, and then climbing up further depending on your choice of materials. It really depends on what you’re looking for, and how chic you’re willing to go. Bands will cost you at least $50, but again climb up into the hundreds. The Ionic, on the other hand, goes on sale for $299.99 on 1 October. You’ll also be able to purchase some bands for $29.99 to $59.99. Thus, Fitbit could easier to get access into market.

Fitbit Ionic vs Apple Watch Series 3: Fitness

There is usual standard of Fitbit fitness features, like Smart Track, VO2 Max and Sleep Stages. The Apple Watch, on the other hand, doesn’t officially recognize as many workout modes as the Ionic. For instance, it doesn’t have a mode for weights or interval training. The Apple Watch also doesn’t automatically track your workouts like the Fitbit does for running, heart beat tracking.

The Ionic is only the second Fitbit to utilize GPS, after the Surge, allowing it to match the Apple Watch in this regard. In our test we found the data of GPS to be pretty on the money, and it didn’t take too long to actually lock on either.

Finally, Fitbit is debuting Fitbit Coach on the Ionic. It’s basically a new version of Fit star, giving users a curriculum of workouts, the company says will tailor to your personal needs the more you use it. With watch IOS 4, the Apple Watch does some light personalized coaching, but it’s mostly on how to close your rings, giving Fitbit the nod here.

Fitbit Ionic vs Apple Watch Series 3: Smart features

Speaking of ecosystems, the Ionic is Fitbit’s best go yet at creating one. There’s an app store here, which Fitbit refers to as a ‘Gallery’. It debuted with just apps from Pandora, Starbucks, Strava and Accu Weather, but that has grown, adding apps from the likes of The New York Times, Nest and more. Apple has had a head start in getting developers in tow, and it’ll take a bit for Fitbit to catch up.

There’s 2.5GB of space for you to either store offline music from Pandora or from your own library. However, since the Ionic doesn’t have cellular capabilities, people can hardly stream music without your phone around.

Fitbit Pay is that company’s foray into payments, thanks to its purchase of Coin. You can take your American Express, Visa or MasterCard and link it up to Fitbit Pay, as well as debit cards from “top issuing banks”. You can link up to six payment cards to Fitbit Pay, while you have a limit of eight on Apple Pay.

While the Ionic plays some good catch up in the realm of music and NFC payments, the maturation of Apple’s ecosystem gives it a bit of a nudge here. However, as Fitbit gets more time to get major apps up and running, Apple may have a serious competitor to worry about, LTE or not, especially as more Pebble developers join Fitbit’s budding platform.

Fitbit vs Garmin

Both have their obvious strengths, but how do their wearable platforms match up? We’ve broken it down to hardware, features, apps, fitness and sports tracking to see whether it’s Garmin or Fitbit that comes out on top.


Garmin vs Fitbit The Hardware

Fitbit has actually been creeping into the world of smartwatches for a while now, with its Fitbit Blaze and Fitbit Surge acting as introductory “fitness watches”, but that doesn’t change that Fitbit got where it is today because of its fitness trackers like the Charge, Alta and Flex.

While the fitness trackers are the spine of Fitbit, its flagship is the Ionic. It’s a big riposte to the Apple Watch, with an app store that’s still growing, contactless payments and more. It’s the most fully featured Fitbit yet, as it pools together smartwatch-like features with both 5ATM water resistance and built-in GPS – features that previously were limited to select Fitbit lines. It’s also built for the future, intended to eventually have features like sleep apnea and atrial fibrillation detection.

As for Garmin, well, things are a little more complicated, such is the depth on offer. In terms of fitness trackers, the headliner is currently the Garmin Vivosport – its latest attempt to compete with Fitbit. While it’s got GPS, heart rate monitoring and VO2 Max, it’s also got a bit of a small and overly sensitive display. It also offers more basic options like the Vivofit 4 that focuses solely on those standard fitness tracking features. So steps, calories, distance and standing hours.

It’s the little things that separate these two. For example, Fitbit will generally provide users with more stylish wearables and much more customization, while Garmin’s devices tends to lean towards a masculine look. To offset this, of course, you’re given a host of physical options to choose from.

Garmin vs Fitbit: Sports Tracking

Not only can you track the likes of running, trail running, hiking, cycling, swimming, skiing, rowing, triathlon training and more, but you can also do this with the in-built GPS or Garmin’s UltraTrac, which conserves battery to keep tabs on your activity over longer distances. Heart rate is also a mainstay within the higher end of Garmin’s range, giving you ample insights into heart rate zones and heart rate variance.

Garmin vs Fitbit: Price

As always, price is something you have to consider, too. While the notable members of Fitbit’s range begin at $99.95 and max out at the $299.95 mark, that barely makes a dent in Garmin’s family. While there’s the $299.99 Vivoactive 3, if you want the latest from the Fenix or Forerunner series, your wallet will be roughly $500 lighter, and that’s a big financial commitment to consider alongside the ecosystem and general features on offer.

Garmin vs Fitbit: The Apps

Take Fitbit, which, while maybe not providing the most detailed after workout metrics in the business, still manages to offer one of the more rounded fitness platforms. This is particularly the case for beginners, who are able to dive into trends, dedicated workouts, sleep tracking and social aspects, such as linking with friends and challenges.

With the Ionic, Fitbit has also launched an app store. It was rough going at first, with only a couple of apps, but the store has gradually grown over the past couple of months, with the likes of The New York Times, Philips Hue, Yelp and more joining the fray.

As for Garmin, you’ll be dealing with Connect, the home of your activity, and ConnectIQ, the store for you to pick up apps and new watch faces. As with Fitbit, we have a comprehensive look on how to run better with Garmin Connect and a Garmin Connect IQ app store guide, but we’ll skim through the highlights here.

The companion app, which is compatible with all Garmin devices and available on desktop, offers you a place to plan, track and review your workouts. So, whether you’re preparing for a marathon and setting monthly goals or simply looking to beat other runners’ best times in local areas, the platform has you covered.

When compared to its Fitbit counterpart, more serious exercisers will find little comparison – Garmin gives you an incredibly detailed look at your activity once you dive past its handy Snapshots, while also allowing you to upload data to the likes of Strava and understand elements like heart rate zones. Even better, Garmin has recently updated ConnectIQ to be more convenient to use for beginners, with an easy-to-digest home screen filled with your stats and metrics.


Geographic area

Headquartered in San Francisco, California, the company has expanded its distribution around the world after nearly a decade of development. In addition to North America, Fitbit has a presence in Latin America, Europe, the Middle East, Africa and Asia Pacific with offices in large cities including Boston, Dublin, Hong Kong, Shanghai, Seoul, Tokyo, New Delhi and Singapore.

But how does Fitbit expand markets and sell their products in other regions? Take China as an example. Fitbit formally entered the Chinese market in June 2014, following its sales footprint in 42 countries around the world. But why did Fitbit choose to enter the Chinese market in 2014? Fitbit studied the research reports on the health status of Chinese consumers. In fact, the future health of the Chinese people deserved attention.


China’s overweight population has risen from 25% in 2002 to 38% in 2012 and this number reached 50% by 2015. In terms of body fat index, on average, Chinese are not as overweight as Westerners, but the incidence of diabetes in Chinese people is as high as 11%, similar to that of the United States. Furthermore, people categorized as obese now accounts for 11% of the total population. Fitbit can help Chinese consumers become healthier, because it has a lot of measurement functions, such as the number of steps walked, steps climbed, heart rate, quality of sleep, and other personal needs involved in fitness. Fitbit’s products function for sports, diet, sleep and weight management and include peripheral systems to help people build healthier lives (Koch, 2016).

In terms of sales channels, Fitbit understands that online sales in China are very important. Following Best Buy, which uses Jing Dong is its online distributor, Fitbit products have started distribution with Jing Dong. In addition, Fitbit’s products are now manufactured in Shenzhen, China, an area that is quickly becoming the technology manufacturing region of the 21st century (Entis, 2017). Fitbit also opened a flagship store in Tian Mall. Additionally, conventional distribution channels such as Amazon, sporting goods stores and most large department store chains all carry Fitbit products. The primary mission of the Chinese team is to broaden Fitbit’s brand awareness so that everyone knows what Fitbit is, how it helps people live a healthier and happier life.

Factors that Contribute to Innovation 

Fitbit’s products pioneered cross-brand compatibility with devices that seamlessly interface with nearly all brands of smartphones and tablets on the market, a key advantage which contributed to their early revenue growth. Today, many smart wristbands and watch products remain limited to either the Android or Apple systems, an obstacle which alienates those consumers who have both types of devices in their household, and while there are also many products that are compatible with both  the iOS  and Android operating systems, most fitness systems continue to ignore the Windows system users. Fitbit in comparison, has managed to build long-term loyalty by creating products that  can be simultaneously operated on IOS, Android and Windows systems, so that their consumers can be assured that the Fitbit app will always be compatible with their future choices in smartphones. The founders philosophy can is evident by their open source access to fitbit servers to allow third party developers to create unique interfaces to the users data files because as founder James Park stated “In an open market, we can better cooperate with local partners. After all, they know more about the local market than we do.” (McNew, 2015).

In addition to their hardware interface versatility, Fitbit’s strategy is aimed at encouraging an open software platform, because Fitbit believes that more innovative ideas can be better exploited through openness and absorption. According to a developer, Fitbits platform has a port opening of the application works in both directions, Fitbit users cannot only send their data through Fitbit to a third-party application. If a user thinks a third-party app is great, they can also send data from a third-party app to Fitbit. For example, a male consumer is very concerned about his diet. He found a great application for eating and drinking, and he was able to import third-party applications into Fitbit via its interface. He can see and record calories on the Fitbit and so on (Schwahn, 2017).

In addition, Technology is a key factor of Fitbit innovation. Since 2009, it has released 15 different products, each of which is an update to the previous one. For example, Fitbit One, released on September 17, 2012, is an updated version of Fitbit Ultra with a more vivid digital display. It has independent clips and separate charging lines and wireless synchronization. Fitbit One is the first wireless activity tracker to synchronize with Bluetooth 4.0 or Bluetooth smart. Wireless synchronization is currently available on iOS and Android devices. Fitbit One can record several daily activities, including but not limited to the number of steps, distance, floors climbed, calories burned, active minutes and sleep efficiency (Jary, 2018).

Competitors in the same field are also important aspect of Fitbit’s innovation processes. Apple, for example, released the Apple watch series 2 in September 2016. The Apple Watch series 2 has better waterproof features, can be worn when swimming or surfing, and can support up to 50 meters of water pressure. Fitbit also took immediate steps. Fitbit Flex 2 was released on 2017, replacing the original Flex, the lowest end of the Fitbit wristband line. This is the first model that was waterproof with swimming tracking. The tracker can be worn on the wrist, pendant or carried in a pocket. When receiving a phone call or text message it provides alerts movement alarm and vibration functions (Jary, 2018).

Entrepreneurial Improvements 

To stay competitive in the wearable tracker market, Fitbit needs to aggressively invest in hardware research in addition to integrating additional richness to their software platform in order to maintain consumer loyalty. Low price is no longer a guaranteed winning strategy in the fitness market, with the differences between style and performance rapidly shrinking, Fitbit needs to enter another business vertical that sets its products apart. We recommend a steady progression into a closely neighboring market of medical devices. We propose Fitbit aim to align with various medical associations to discover best healthcare practices and create apps for physical treatments fighting illness and disease. If the highly accurate heart rate monitor can identify specific exercises performed by the readings of active heart rates, why can’t it detect palpitations and arrhythmias?

Along with alerts to potential health irregularities, Fitbit should develop software to allow consumers to easily share their tracked data with their healthcare professional. Organizing this data to be analyzed by physicians can open a dialogue with patients to work toward their goals in a safe, customizable fashion. Breaking into healthcare software opens the door to high potential revenue growth, if Fitbit is the first to curb this market.

 Unmet Markets and Missed Opportunities 

In 2014, just four years after Fitbit’s initial distribution, advancements were made in optical heart rate monitoring technology, now Garmin and Polar are producing similar activity trackers at a similar price points. While emerging technology would soon drive additional demand for wristband fitness trackers that increases the size of the pie, it will also breed new competitors who were better positioned to capitalize on consumers with special concerns for heart health along with athletes desiring deeper training feedback metrics.

These advancements in heart rate monitoring technology allowed those serious athletes and health-conscious consumers to abandon their chest strap transmitters for a single unit, rechargeable wrist monitor that integrated real-time pulse-rates along with 24-hour wear ability (Cook, 2017). As a result, Fitbit’s previous competitive advantage of one-piece simplicity was disrupted. To compound Fitbit’s new competing technology, they failed to license the technology in time to be the first to market with the new optical heart rate and activity wearables. Instead, a new competitor, Epson, led the optical heart rate integrated monitors a full year prior.

Fitbit’s first entry in the new market, the Charge HR, missed its planned holiday 2014 release date, instead arriving late to market with an underwhelming level of fanfare in January 2015 (Seitz, 2016). The Charge HR was quickly overshadowed by an improved Apple Watch only three months later. As with many Apple products, the features of their new watch were widely publicized through a big budget marketing campaign, which was the first to educate mainstream consumers on the benefits of wrist worn heart rate monitors. However, Fitbit did outmaneuver one of its main competitors, Polar, which lagged a year behind Fitbit in its release of a pulse monitoring wristband (Lashinsky, 2016).

Today, Fitbit continues to face tough competition from the Apple Watch and new fitness technology that offers precision level EKG quality heart rate hardware. Apple was quick to acquire the company who created this technology, with hopes of integrating it into a new market of heart conscious consumers. The future possibilities for the Apple Watch include sending 911 notifications if the user’s heartbeat stops or sending an alert to a user when one’s pulse indicates a warning of an oncoming heart attack. The technology could also prove valuable in solving crimes by alerting authorities the precise time and location of a murder or fatal accident. If Apple pioneers such lifesaving technology in an affordable package with a multitude of companion features, it would be safe to assume a dimmer forecast for Fitbit’s market niche (Feel the Beat of Heart Rate Training, 2017).

References

http://www.sec.gov/Archives/edgar/data/1447599/000119312515376713/d54385d424b4.htm. Accessed 28 Jan. 2018.

Abrantes, Ana M. “Regular article: Developing a Fitbit-supported lifestyle physical activity intervention for depressed alcohol dependent women.” Journal of substance abuse treatment 80(2017):88-97. Web.

Cadmus Bertram, L., Gangnon, R., Wirkus, E. J., Thraen Borowski, K. M., & Gorzelitz Liebhauser, J. (2017). The Accuracy of Heart Rate Monitoring by Some Wrist-Worn Activity Trackers. Annals of Internal Medicine, 166(8), 610-612.

Compare Fitbit Ionic vs Nokia Steel vs Nokia Steel HR vs Withings Activite - Fitbit IoTeam Fitbitnic vs Nokia Steel vs Nokia Steel HR vs Withings Activite Comparison by Price, Specifications, Reviews & Features | Gadgets Now. www.gadgetsnow.com/compare-smartwatch/Fitbit-Ionic-vs-Nokia-Steel-vs-Nokia-Steel-HR-vs-Withings-Activite. Accessed 28 Jan. 2018.

Compare Fitbit Ionic vs Nokia Steel vs Nokia Steel HR vs Withings Activite – Fitbit Ionic vs Nokia Steel vs Nokia Steel HR vs Withings Activite Comparison by Price, Specifications, Reviews & Features | Gadgets Now. http://www.gadgetsnow.com/compare-smartwatch/Fitbit-Ionic-vs-Nokia-Steel-vs-Nokia-Steel-HR-vs-Withings-Activite. Accessed 28 Jan. 2018.

Cook, J. D., Prairie, M. L., & Plante, D. T. (2017). Research paper: Utility of the Fitbit Flex to evaluate sleep in major depressive disorder: A comparison against polysomnography and wrist-worn actigraphy. Journal Of Affective Disorders, 217299-305. doi:10.1016/j.jad.2017.04.030

Discrimination. http://www.2020wob.com/labels/discrimination. Accessed 28 Jan. 2018.

Eadicicco, L. (2017). Fitbit May Have a New Way To Detect an Irregular Heartbeat. Time.Com, 1.

Entis, L. (2017). DATA WON’T MAKE YOU FIT. Fortune, 176(2), 33-35.

Farr, C. (2016). Fitbit at work. Fast Company, (205), 27-30.

Farr, Christina. How Fitbit Became The Next Big Thing In Corporate Wellness. 22 Apr. 2016, http://www.fastcompany.com/3058462/how-fitbit-became-the-next-big-thing-in-corporate-wellness. Accessed 28 Jan. 2018.

(2017). Feel the beat of heart rate training. Harvard Men’s Health Watch

Cnbc. FIT: Fitbit Inc – Stock Quote and News. 13 Nov. 2017, http://www.cnbc.com/quotes/?symbol=FIT. Accessed 28 Jan. 2018. 

Fitbit. http://www.crunchbase.com/organization/fitbit. Accessed 28 Jan. 2018. 

FitbitIncA.insiders.morningstar.com/trading/board-of-directors.action?t=FIT®ion=usa&culture=en-US. Accessed 28 Jan. 2018. 

Fitbit Selected for National Institutes of Health (NIH) Precision Medicine Research Program with The Scripps Research Institute (TSRI). investor.fitbit.com/press/press-releases/press-release-details/2017/Fitbit-Selected-for-National-Institutes-of-Health-NIH-Precision-Medicine-Research-Program-with-The-Scripps-Research-Institute-TSRI/default.aspx. Accessed 28 Jan. 2018. 

Fitbit to Donate $1 Million Across Three Charities With FitForGood. investor.fitbit.com/press/press-releases/press-release-details/2015/Fitbit-to-Donate-1-Million-Across-Three-Charities-With-FitForGood/default.aspx. Accessed 28 Jan. 2018. 

Fitbit进军中国市场,如何做好本土化?. finance.sina.com.cn/leadership/mroll/20140617/084619434461.shtml. Accessed 28 Jan. 2018.

Hendrickson, Mark. Fitbit Raises Healthy $2 Million From True Ventures And SoftTech VC. 10 Oct.2008,Techcrunch.com/2008/10/10/fitbit-raises-healthy-2-million-from-true-ventures-and-softtech-vc/. Accessed 28 Jan. 2018.

Huang, Y., Xu, J., Yu, B., & Shull, P. B. (2016). Validity of Fitbit, Jawbone UP, Nike+ and other wearable devices for level and stair walking. Gait & Posture, 4836-41. doi:10.1016/j.gaitpost.2016.04.025 

IDC Forecasts Shipments of Wearable Devices to Nearly Double by 2021 as Smart Watches and New Product Categories Gain Traction. 20 Dec. 2017, http://www.businesswire.com/news/home/20171220005110/en/IDC-Forecasts-Shipments-Wearable-Devices-Double-2021. Accessed 28 Jan. 2018.

Imbert, Fred. Fitbit up 20%, nearly doubles IPO price. 22 June 2015, http://www.cnbc.com/2015/06/22/fitbit-stock-opens-up-more-than-10.html. Accessed 28 Jan. 2018.

Ingber, Janet. Product Evaluations and Guides. http://www.afb.org/afbpress/pubnew.asp?DocID=aw170305. Accessed 28 Jan. 2018.

Jary, Simon. Fitness face off: Apple Watch vs Fitbit. 25 Jan. 2018, http://www.techadvisor.co.uk/feature/wearable-tech/fitbit-vs-apple-watch-2017-3612954/?p=2. Accessed 28 Jan. 2018.

Kerner, C. (2017). The Motivational Impact of Wearable Healthy Lifestyle Technologies: A Self-    determination Perspective on Fitbits With Adolescents. American Journal of Health Education, 48(5), 287-297.

Koch, P. (2016). No. The fitness tracker is not a fad. Men’s Fitness, (7). 94.

Lashinsky, A. (2016). Why Fitbit Faces Investor Skepticism Over Its Fiscal Fitness. Fortune.Com, 12.

Lawler, Ryan. Fitbit Raises $43 Million From Qualcomm Ventures, SAP Ventures, And SoftBank Capital. 13 Aug.

2013, techcrunch.com/2013/08/13/fitbit-43m/. Accessed 28 Jan. 2018.

Marshall, Gary. The story of Fitbit: How a wooden box became a $4 billion company. 9 Sept. 2016, http://www.wareable.com/fitbit/youre-fitbit-and-you-know-it-how-a-wooden-box-became-a-dollar-4-billion-company. Accessed 28 Jan. 2018.

McNew, Seth. Fitbit’s 7 Competitive Advantages Over Other Brands. 5 Sept. 2015, http://www.fool.com/investing/general/2015/09/05/7-competitive-advantages-fitbit-says-it-has-over-o.aspx. Accessed 28 Jan. 2018.

 Nielsen: 46 million people used fitness apps in January. 17 Apr. 2014, http://www.mobihealthnews.com/32183/nielsen-46-million-people-used-fitness-apps-in-january/. Accessed 28 Jan. 2018. 

Optical Heart Rate Monitoring: What You Need to Know. 12 Oct. 2017, valencell.com/blog/2015/10/optical-heart-rate-monitoring-what-you-need-to-know/. Accessed 28 Jan. 2018.

Pressman, A. (2016). Investors in GoPro and Fitbit Discover Hardware Is Hard. Fortune.Com, 1.

Rao, Leena. Fitness Tracker Fitbit Raises $12M To Market New Wi-Fi Enabled Smart Scale, Aria. 24 Jan. 2012, techcrunch.com/2012/01/24/fitness-tracker-fitbit-raises-12m-to-market-new-wi-fi-enabled-smart-scale-aria/. Accessed 28 Jan. 2018.

Schwahn, Lauren. Withings Steel HR vs. Fitbit Blaze. 22 June 2017, http://www.nerdwallet.com/blog/shopping/withings-steel-hr-vs-fitbit-blaze-activity-tracker-comparison/. Accessed 28 Jan. 2018.

Sedaris, David. Stepping Out. 19 June 2017, http://www.newyorker.com/magazine/2014/06/30/stepping-out-3. Accessed 28 Jan. 2018.

Seitz, P. (2015). Fitbit signs up 20 new corporate wellness clients. Investor’s Business Daily.

Seitz, P. (2016). Fitbit fall giving investors heart attack. Investor’s Business Daily.

(2016). SHAREHOLDER ALERT: Bronstein, Gewirtz & Grossman, LLC Reminds Investors of Class Action Against Fitbit Inc. FIT and Lead Plaintiff Deadline: March 11, 2016. Marketing Weekly News.

Smith, Craig. 37 Amazing Fitbit Statistics. 24 Nov. 2017, expandedramblings.com/index.php/fitbit-statistics/. Accessed 28 Jan. 2018.

Tsotsis, Alexia. Fitness Tracker Fitbit Gains Another $8 Million. 10 Sept. 2010, techcrunch.com/2010/09/10/fitbit-8-million/. Accessed 28 Jan. 2018.

Welch, Chris. Fitbit Blaze review: a ‘smarter’ fitness tracker is still kind of dumb. 15 Mar. 2016, http://www.theverge.com/2016/3/15/11225080/fitbit-blaze-watch-review. Accessed 28 Jan. 2018

Data Analytics: Influences of Gross Film Revenue Across Three Decades


Data Analytics: Influences of Gross Film Revenue & Opportunity Analysis

December 6, 2017

Todd Benschneider, Austin Deno, Leigh Harris, Sarah Lassiter, Lisa Velesko
Table of Contents

Problem Significance:                                                                                                         3-4

Data Source & Preparation:                                                                                               4-5

Variable Selection:                                                                                                              5

Preliminary Analysis:                                                                                                          6-8

Models:                                                                                                                                  8-12

Insights:                                                                                                                                 12-13


Problem Significance:

Several societal trends can be mined from the data captured in consumer spending patterns of the film industry, especially a comparison of different genres of films which indicate rising and falling patterns of popular fiction. Films, more so than television, literature, or music, closely correlate with upcoming trends by using a responsive pull towards consumer tastes in fiction-fantasy and most accurately reflects the psyche of a generation and its ever shifting emotional underpinnings. The nimble demand responsiveness of filmmakers has become astoundingly proficient at catering to the emotional voids that drive the fiction market and are reflected with clarity in the ever changing mix of successful films. Through the unspoken demand for clearly defined types of storylines, these quickly produced films reveal a meaningful cross-section of a society’s unfulfilled drives and highlights which particular aspects that a society’s members yearn for in their own life situations.

In addition to trending popularity of varying scripts, other valuable economic indicators can be harvested through reverse engineering techniques to capture the downward trending genres that clarify the contextual changes that indicate which previous underlying drives have since been fulfilled through sociological evolution. Marketing professionals are wise to take note of the peaking decline of each passing trend, as those peaks and valleys encapsulate at a macro level of measure, the unspoken barometers reflected in the overall mood of a culture.

In the industries of entertainment and media, consumer spending directed towards different types of fiction produces great insight into the long-term patterns of emotional and economic wants, that are as useful to producers of consumer goods, as they are to providers of entertainment. It is imperative for businesses to be on the forefront of any trend.

Our data set summarizes three decades of consumer spending trends on tales that potentially reveals early predictors of future spending behaviors. It is through the trend forecasting of these patterns of film revenue data, that a business can be on the forefront of meeting changing consumer tastes, whether that firm creates new movie plots, automobiles, or widgets. With insight into the deepest desires of the society around it, a business can tailor its marketing message to align its product with a representative cross-section of every consumers vision, of not who they are, but instead, what they want to be. Few other data sources can provide the insights into the self-identity of fantasy characters as well as film plots and with this three decade dataset, we expect to gauge the tipping points of long term trends and witness the rebounds that those tipping points predicted.

Our team viewed the movie revenue data from the perspective of a movie merchandiser, evaluating which unreleased movies in production would provide our firm with its highest return on investment for movie-themed posters, toys, clothing and related merchandise. The highest budget films command the highest royalty percentages and also require the greatest undiversified commitment of our manufacturing lines to individual movie projects. Because of the risk and profitability factors affiliated with marketing the high budget prospects, our team instead drilled down into the data looking for the more cost effective prospects. Films that maximize the return on investment allow our firm to utilize a more diversified portfolio of projects with more promising cash flows.

With this goal in mind, we chose instead, to use regression models to dig deeper into other categorical data from the set, hoping to find other actionable predictors that could be valuable on a shorter time-line. With that goal, we evaluated the given variables in search of the most significant predictors to cinematic success to determine the confidence of future investments.

Data Source & Preparation:

The data set was originally gathered from IMDb and then sourced directly from Kaggle using 6,820 movies from 1986 to 2016 and includes details such as budget, gross revenue, the production company, country of origin, director, primary genre, movie name, motion picture rating, date released, runtime, IMBd user score, lead star, IMBd user votes, writer, and year released.

Not all movies contained information regarding the budget of the movie.  Those were removed as it was critical in our analysis to be able to collate the relationships for complete data points, especially in regards to budget.  We also investigated the relationship between profit and return on investment between gross and budget independently.

Tableau and Excel were first used to identify the greatest amounts in each respective variable.  This allowed us to postulate our first level of filtering.  R was then used to plot data using histograms, box plots, and scatter plots to consider outliers, run regression models, multicollinearity and direct correlations, identify R-squared and adjusted R-squared, along with Aikaike Information Criterion (AIC) and Bayesian Information Criterion (BIC), to determine goodness of fit, utilized numeric and qualitative predictors, and with interaction.  Charts in Tableau were generated to visually verify the interaction effects.  Tableau, Excel, and R were all used collectively to ultimately determine the strongest correlation, interaction, numeric, and qualitative predictors in using the variables.

Variable Selection:

Response Variable: In our effort to uncover the driving forces behind blockbuster films, we questioned what causes box office achievement. There are far too many flops in show-business; artistic potential is drowned out, consumer trends are completely misinterpreted, and lucrative investments are wasted. We must review success in cinema and provide a supportive study to investors in major motion pictures to appease the masses and create a stable platform for performers, thereby providing a concrete analysis of how gross revenue is determined. We therefore selected “Gross”, defined by our IMDb source as “gross revenue at the box office” as our response variable for all data modeling in this study.


Predictor Variables:
In order to evaluate the best variables to test against our response variable, we created a correlation table (below) to test the relationship amongst the quantitative variables. We focused on which variables could have a strong effect in deciding gross. The motive in tracking down the most determinant variables is so the investor can later account these factors into their decision to support a film.

Correlation Chart Budget Gross Runtime Score Votes
Budget 1 0.680033 0.313064 0.073579 0.451467
Gross 0.680033 1 0.253273 0.229552 0.642904
Runtime 0.313064 0.253273 1 0.417031 0.359817
Score 0.073579 0.229552 0.417031 1 0.470648
Votes 0.451467 0.642904 0.359817 0.470648 1

To no surprise, the correlation that stood out the most was between gross revenue and budget with .68003256. This correlation suggests that a higher budget movie will most likely fund a movie that generates more revenue. As we believe budget is the heaviest deciding factor in funding the crucial elements for a financially successful film, we regard it as our primary predictor variable which our other qualitative and quantitative variables will be matched against.


The second highest correlation was found between “gross” revenue and “votes” (that is IMBd viewer reviews on a scale from 1 to 10) at .642904. We can justify this correlation two-fold. First, more “votes” logically means more tickets were purchased to watch the movie in theaters. Second, a high number of votes can drive consumer demand, influencing movie-goers who have not yet viewed the film to either watch or avoid depending on how positive the review was. While our first conclusion is provided after the fact of viewership, the second has the potential to boost viewership, making this variable causal. However, since we cannot account for whether “votes” were causal or coincidental, and since the standard error in a simple regression with gross is very large, we decided not to make it a popular predictor variable in our study. Derived from the votes, we deemed “scores” as unacceptable variables in our models because we cannot control the scores that are given by the reviewers.


As “runtime”, the final quantitative variable which refers to the length of the film expressed in minutes, has a relatively moderate correlation with “gross” at positive .2532733, we must take into consideration what this logically means. The correlation expressed as runtime increases, gross revenue also increases. We know that this statement has a limit because if movies were formatted into countless of hours, we cannot logically expect the popularity to rise accordingly. In support we also can see from a simple regression that, like the “votes” variable, “runtime” standard error at 52262 is unacceptably high.


As far as qualitative data, we opted to use both primary “genre” and motion picture “rating” as major predictors of gross, as supported by their high multiple r-squared values. We determined these were likely predictors of movie success based on consumer taste.


Finally, we decided not to use the production company, country of origin, director, movie name, date released, and year released as these factors would be completely out of control of the film investors. This is due to the variables being too widely diverse to classify accurately since they are spread so thinly across the data.

Preliminary Analysis:

Following our variable selection, we began looking at patterns surrounding the relationships between revenue and movie genre and motion picture rating. It’s important for investors to stay current on consumer trends in order to predict where the big money will be made in the film industry.
Hypothesis Testing:


Hypothesis 1:

  1. Since the Action genre and PG-13 rating have the highest gross revenue out of all movies, it is logical to assume that these types will also generate the highest return on an investor’s funding once the production hits the theaters. We have solid evidence that this is true because budget accounts for over 47% of the prediction of a high grossing movie.

H0: Action genre and PG-13 rating have the highest return on investment and an Action PG-13 rated movie will generate the most dollars per dollars invested.
Ha: Action genre and PG-13 rating do not have the highest return on investment.

Genre:

After realizing high correlations between gross and motion picture genre, we dove into separating genres to see which classifications raked in the most at the box office. We found that the movies with the highest gross revenue were Action with
a combined total of over $708 million. By seemingly no coincidence we also noticed that Action movies
had a higher total budget than all other genres. Since budget has a strong linear correlation with gross, we can assume that Action will produce the highest return on investment than any other genre.
Rating:

We similarly compared motion picture ratings to gross revenue to identify that PG-13, R, and PG, respectively, generated the most revenue over the course of the 30 year history and looked at the gross revenue and budget within each sector.


Hypothesis 2: Since popular actors have a strong influence over consumer taste, we can assume that starpower has a significant effect on gross revenue. Since high budget is needed we can also assume that as budget increases, more coveted actors can be casted, resulting in a very popular, high grossing film.


H0: Movies with budgets in the upper 3rd quartile will have a significant relationship between star and gross.
H1: Movies with budgets in the upper 3rd quartile will have no relationship between star and gross.


Star: We attempted to identify the correlation of stars to gross revenue by exploring the total number of movies that they been the lead in and the sum of the gross revenue for those movies using Tableau.  We believed that particular stars would impact the budget and also impact the gross revenue.  Frequency of a star being in movies could also lead to their popularity and consequently generate more box office revenue as consumer-demand increased to see that star.  In running a regression model, there were specific stars, such as Chris Pratt(1), Daisy Ridley(1), Ellen DeGeneres(1), Felicity Jones(2), Heather Donahue(1), Jennifer Lawrence(8), Louis C.K(1), Neel Sethi(1), Paige O-Hara(1), Quinton Aaron(1), Sam Neill(3), Sam Worthington(4), Scott Weinger(1), and Taylor Kitsch(1) that had significant influence as interacted with budget to predict gross revenue.  With all but Jennifer Lawrence being listed as the star in less than five films and most less than two, as indicated by the number next to each star, we determined that there were additional factors driving this further, such as co-star, if the movie already had a cult following, was a book first, etc.  We did run a sample test using Jennifer Lawrence and Will Smith to note that, at least for these two stars, there was a positive correlation between gross revenue and budget as depicted in the scatterplot below.


Models:

Model 1<-lm(d$gross ~ d$budget)

The correlation chart was a basic look at the significance between gross revenue at the box office and film budget. We soon affirmed our prediction that the correlation between budget and gross was causal by running a simple regression. With a multiple r-squared value of .4624, this model shows that 46.24% of gross revenue can be explained by the budget. Budget also has a very low p-value (2e-16), proving to be a significant factor in predicting a high gross. A higher budget movie has greater potential to purchase the necessary artists, talent, and advertising to create a higher grossing product.
Model 2<-lm(d$gross~d$budget+as.factor(genre), data=d)

Using the as.factor for genre we are able to build a second model that explains how a movie budget and genre affects the revenue of a movie. This model had a slightly higher adjusted R-square with .4691. This model also shows that out of all the genres, the most significant ones were Action, Adventure, Animation, Comedy, and Horror. This indicates that these five genres will be more impactful on the revenue of a film with knowledge of the budget of the film. However, without knowing the budget, Comedy, Drama, and Horror have the most significant impact on gross revenue.
However, we know that correlation does not translate to causation. We carefully curbed our analysis with a linear regression model, placing “Gross” as the response variable and “Budget” as a factor of “Genre”. We used budget as a control because we want to know how the effect of dollars invested in a movie, and more specifically movie genre, would be returned. To our surprise, Action was not the most significant factor, Animation was, as confirmed by a lower p-value and a higher coefficient. In fact, the regression explained that with a hypothetical budget of $0, an Animation movie would produce $22.2M more in revenue than an Action movie. This was an astonishing and valuable discovery.  We noted that Action, Adventure, Animation, Comedy, and Horror all had significant influences.
Model 3<-lm(d$gross~d$budget+as.factor(genre)+d$budget*as.factor(genre), data=d)

For our third model we adjusted it to show a model that explains gross revenue with the budget and genre of the film and the interaction effect between budget and genre. This model was slightly better with an adjusted R-Square of .4696. The model showed that a specific genre budget has a slight effect on gross revenue. Budget is more significant for the Action, Comedy, Drama, and Horror genres.

Model 4<-lm(d$gross~d$budget+as.factor(rating)+d$budget*as.factor(rating), data=d)

For our fourth model, we looked at gross revenue with the interaction between budget and rating. This helped us narrow our data to find the most significant rating for gross revenue as budget increases. This model had an adjusted r-square of .4736. Out of all the different ratings, rated R and G movies were the most statistically significant.


Looking at just the adjusted r-squared and the AIC/BIC; the fourth model was the best predictor of increasing gross revenue. However, the rating to budget interaction was only slightly better than the genre to budget interaction. Both our third and fourth model narrowed down our data because they took into consideration the genre and rating with respect to budget of the film. These two qualitative variables were the most significant in predicting the gross revenue outside of just the movie budget.  In joining the interaction together, PG-13 and Horror had the highest and only interaction, with a slightly higher R-squared but higher AIC and BIC, therefore prompting us to return to the previous model and generating the below chart to illustrate our findings.


Confidence Interval Testing:


With the information we gathered from the regression models, we now have an in-depth look at the effect of budget on genre and rating as they relate to gross revenue. However, these findings contradict our earlier hypotheses. To examine our original assumptions, we performed confidence interval testing.


First, we subsetted the data by creating a new dataframe with only Action genre movies rated PG-13. Then we created another variable, ROI, by implementing the ROI formula using budget and gross data sets. We took a summary of the data discovering the mean ROI for PG-13 Action movies was .1666255 or 16.67%, which seems reasonable. If an investor was to invest $100,000, they could expect an average gross return of $116,000 after the movie hits theaters. With a sample size of 468, we used the normal distribution and with 97.5% confidence to determine that the range for ROI on this type of movie would fall between .0899811 and .4232491. This is a fairly large range. But we can say confidently that the largest return on investment should be 42.32%.


Using the assurance of strong significance, and high coefficient strength of our regression models, we will use the same confidence interval testing on an R rated Horror film to test the strength of our first null hypothesis. We performed the same subsetting technique to attain a dataframe of only R rated Horror movies to gather a set of 173 movies. After removing two extreme outliers, the mean ROI was pinpointed at 2.6610 or 266.1%. The testing gave us 97.5% confidence that the range of expected ROI should fall between 113.89% and 646.1%.


Concluding, R rated Horror movies have a 97.5% confidence in producing a high of 646.1% ROI compared to the maximum potential of 42.32% of a PG-13 Action movie.
We can view this practically and justify the logic in Horror movies having the highest total ROI. When looking at the data it seems that horror movies can be made with relatively low budgets and yield much higher profit. Movies like Paranormal Activity and The Blair Witch Project (the two outliers we removed before confidence interval testing) are prime examples of this phenomenon. The Blair Witch Project cost only around $15,000 to make, but made $107,918,810 in box office revenue, a 7,193% ROI. This data will allow us to make the most informed decision in consideration for investing or merchandising.


Insights:

In analyzing the data, we uncovered that budget had the strongest significance and correlation to gross revenue.  Genre as a factor of budget, nor rating, influenced the gross revenue more than the budget itself but were highly significant subfactors.  Ratings of “R” and “G” along with genres of Action, Comedy, Drama, and Horror, had the highest significance when factored with budget to gross revenue, as depicted in the charts above.

As score and and votes would come after the fact, an investor or merchandising company looking to predict which movies would gross the highest revenue and consequently have the potential to yield the highest returns on product related to that movie, we would look to an “R” or “G” rated movie that is an Action, Comedy,Drama, or Horror genre specifically. This can be demonstrated by the movie “The Hangover,” which led to a major economic impact in Las Vegas.

In conclusion, while we have familiarized ourselves with the tools and theories of data mining for business applications, the most important lesson we have learned, has been to view data insights with cautious skepticism. We are confident that our regression analysis was accurate and that our data source appeared reliable; however, few of us are prepared to wager our professional reputations by advising a CEO to allocate millions of dollars of investor capital into the actionable insights that we are recommending. In the actual practice, we would be recommending finding alternate sources of similar data sets to verify these conclusions. In addition to our newfound perspective on the practical values of data mining, we are now prepared to temper future data sourced predictions with a managerial “P-Value”, named the “Group 6 N-Value” to represent common sense and intuition. We therefore recommend, that when proposed data sets lead us down a path of  assumptions based on high P and Adj R sq values, but contradict our own personal “N-Values”, we should first pursue additional data sets and alternate models to demonstrate, without doubt, that those high statistical probabilities are indeed replicable and justifiable in the abstract science of strategic management and consumer behavior.

Italian Assignments, Navigating Cultural Differences

Italian Assignments – Guidelines for Navigating Cultural Differences

University of South Florida

December 4, 2017

Todd Benschneider, Gabriel Bussell, Ali Dogan Sivritepe, Pam Sundown


Table of Contents


  1. Employee Responsibility and Preparing for Success
  2. Bureaucratic Tasks and Tips
  3. Anticipated Economic Adjustments
  4. Schooling for Children
  5. Transportation
  6. Housing
  7. Medical Care
  8. General Business Etiquette
  9. Effective Negotiation Styles
  10. Dress Code and Personal Fashion
  11. Dining Etiquette
  12. Gifts
  13. References

Employee Responsibility

Please understand that your assignment is first and foremost to serve as a corporate diplomat for your employer: Interglobal. One thing that is certain, you should expect that the progress toward your business objective to take much longer than you anticipate, so please adjust the timelines of your assignment objectives to accept these differences, a good rule of the thumb is U.S. estimated timeline multiplied by 2.5 (20). It will also benefit you to resign to the fact that controlling your Italian business partners sense of urgency or work ethic will usually damage relationships. With that stated, your first task will be to adapt your pace to the Italian partner’s timeline.


In addition, it is your duty to understand the Italian’s “Ugly American Stereotype”, and avoid reinforcing any negative preconceptions such as: Americans are rude, self-righteous and condescending towards their Italian hosts. It is imperative to understand that over 30% of American expats abandon their first foreign assignment in the first twelve months, the high failure rate is easily reduced by intensive culture preparation like the training course you have been provided (20).


Another obstacle in cultural acclimation is the preparation of your family for the assignment, which is why they will also be participating in preparatory conditioning for the cultural adventure the family is about to embark upon. Success on a foreign assignment will prove your resourcefulness and adaptability and be an important stepping stone in the advancement of your areas of responsibility here at Interglobal.

BUREAUCRATIC REQUIREMENTS FOR YOUR EXPAT ASSIGNMENT

For Italian work assignments that last longer than three months, US citizens are required to obtain a “National Work Visa”. Most companies handle the application on your behalf; however, the approval process usually takes six to nine months; therefore, it is imperative that you follow the status of the application and understand your company’s policy. Family visas are comparatively simple to acquire after your National Visa has been granted, your family will only require a written request and valid passport to join you (12).


Depending on the living arrangements provided by your employer, you will probably need also to apply for a residency permit to rent or purchase a home. With a residency permit, you will need to apply for tax number, this number, much like a social security number will be required for many routine family needs such as obtaining insurance or healthcare (12).


In addition, most expats learn the hard way that their U.S. mobile plan does not transfer to Italy and that roaming charges can rack up a frightening bill unless you modify your plan to an international package prior to your arrival. For business purposes it is standard to have a prepaid Italian SIM card installed on your mobile phone which can convert your current smartphone to a local Italian phone number. When you want to switch back to your American number, you just swap back to the original SIM. A popular technology in Italy has become dual SIM mobile phones that allow you to carry two independent phone lines on a single phone, one as your personal number and the other as your work number (19).


ANTICIPATED ECONOMIC ADJUSTMENTS

The cost of living in Italy is not significantly higher than in the US, but the regionally adjusted income to cost of living equates to around 50% higher depending on region. The first observations many expats realize is are larger pay gaps between junior and mid-level managers, this may be a factor of the Hofstede Power Distance Index of 50 compared to the US score at 40 (9). The Hofstede-insights.com website is a valuable tool to use in understanding international cultural differences. For example, Italy pays its young workers the lowest entry level wages when compared to its western European neighbors, you can expect to find students from with excellent academic credentials hiring in at a 2016 average starting pay that equates to $32,500. In contrast nearby Switzerland offers its new graduates an average starting salary equal of $99,300. In the United States you are accustomed to working with young college graduates that typically hire in at $50,200. Fortunately for our prospective mid-career expats you will learn that Italy uses the money saved on young employee salaries to compensate older workers. While still at 11th of 15 western European countries Italy pays its mid-level supervisors the equivalent of $84,100 annually, which climbs quickly as you climb in the corporate ranks (14). These salary differences are partly cultural and due to the fact that Italy has limited resources that impact its current potential GDP. On the following page are detailed comparisons of each region’s major city with cost of living compared to Tampa. You will notice surprisingly inexpensive rents but low local purchasing power due to lower average salaries and higher tax rates (13).


Milan’s Local Salary Purchasing Power is 50% lower than Tampa’s

Rome Local Salary Purchasing Power 49% Lower than Tampa

Naples’s Local Salary Purchasing Power is 59% lower than Tampa’s


SCHOOLING FOR CHILDREN

Most expat families send their children to international schools to alleviate the challenges of mastering academic fluency in a second language. The benefit of attending an accredited international school, is that these institutions provide a standardized coursework that transfers into other international locations and can increase chances of being accepted into the most selective international universities (11).


In Italy, schooling is broken into three cycles plus kindergarten, which begins with three years of optional kindergarten through age six, then a mandatory elementary school through age 11, during this cycle Italian education system requires all students to learn two foreign languages, the first is typically English which is introduced while children are seven years old, a second foreign language is required at age eleven (7).


Following the elementary school cycle, Italian children enter middle school for ages eleven through fourteen. At fifteen they begin the third cycle that we call high school which they are required to take an admission test to qualify for the academic courses to prepare them for the universities. If their academic skills lag their peers, they will typically be assigned to a vocational training school rather than a high school (11).


TRANSPORTATION

You should plan on relying on public transportation for the first several months, since you are legally required to carry an International Driving Permit to rent a car. In addition, expect to pay about 60% more for gasoline, however on the bright side, Italians also drive on the right side of the road and most major highways have no speed limits (7).


Public buses and trains are the most affordable and reliable mode of transportation in major cities, many expats use the iBus line.  Fortunately, Uber has become very popular in Italy’s major cities in recent years and is often the most affordable mode of transport in many areas, however the Uber network is not well developed in smaller towns (7). Unlike Uber, many taxi drivers will frequently take advantage of foreigners by insisting on payment much higher than the meter reading (7).


HOUSING

While many of you will be taking advantage of housing provided by the company, some may choose to explore alternative housing, especially those who find a work from home culture. In Milan and Rome, many prime apartments are being bought up by investors and utilized as AirBNB rentals, which is a type of personal Home to rental Hotel room application that works on a similar principal as Uber as does for personal transportation, this trend is creating a shortage of small apartments with a view of the city (12); however, it is an excellent way to rent for a short while in different parts of the city prior to signing rental contracts.


MEDICAL CARE

Italian employers are required to contribute to the government health insurance of their workers. Unemployed and retired are covered by the government plan which ensures that as a nation, Italians are well cared for. In comparison to other overseas assignments, Italy provides some of the best healthcare for its residents, including expats. Expats may want to consider private add-on insurance to expedite the timeliness of their medical care visits, especially on assignments where they may not qualify for the host company insurance provisions. As a general rule of thumb, medical attention is given to all regardless of insurance coverage, add on insurance speeds the process and covers most items not covered by the government health insurance. Consult with other expats in your region for their recommendations on medical centers that are familiar with the expat health insurance requirements (12).


GENERAL BUSINESS ETIQUETTE

As a rule, Italians have difficulty trusting strangers and most business relationships require and introduction by a third party from the host culture. It is generally considered unprofessional to approach executive level business partners and introduce yourself to begin pitching them your ideas, instead you would normally be introduced to them by someone of similar rank that vouches for your expertise and trustworthiness and begins the conversation for you mentioning your expertise on solutions (10).


While English is often the preferred second language of Italian international firms, you should understand that most professionals expect you learn Italian to be accepted into the inner fold of office politics. The Italians are very proud of their heritage, language and culture, and have a hard time building relationship with foreign business associates that are not interested in learning their language. Remarkably, even if you have a mastery of the standard Italian dialect taught to American students, you should expect to be puzzled by the countless number of local dialects that distinguish one region from another (8).


NEGOTIATION STYLE

Overcoming the differences in negotiation styles between the American approach that you might take for granted and the decision-making processes of your Italian counterparts has the potential to make or break your success on the assignment. In the first year on your Italian assignment you will wise to negotiate using a host country assistant since mistakes made during this period can cause long term damage to your relationships. You can expect to have a difficult time gaining access to decision makers above your own rank, in the Italian business world, the decision makers are rarely in the meeting where the negotiations take place, because of this you can expect that no hard decisions are normally made during the meeting. You are simply presenting your side and responding to their objections, the junior associates at the meeting will relay the information to the decision makers and who may mull over the proposal for months before responding that they are interested (22).


In Italy, decision makers are expecting to deal with someone their own level of seniority, so if you are under 35, it will be wise to reconsider representing yourself in the negotiations, the Italians can feel insulted that they are not dealing with your boss, even if you are the sole decision maker. With that in mind, if the Italians send older representatives to the negotiating table, be certain to address them first, last and with a great deal of deference, even if you are unsure that they are the true decision makers.


Italian corporate culture typically requires that a respected host country executive introduce the interested parties, during that introduction day, avoid talking business unless a senior member of their team specifically brings up business matters. Expect several weeks to pass and several visits before the prospects bring up business. It is at these critical points that you be patient and respect their business traditions, this is an area where many Italians expect you to turn into “an ugly American” and try to rush them into viewing you as a trusted business partner. Your Italian partners feel that high pressure tactics are an indicator that they are being tricked into an agreement that is not in their best interest, by instead drawing out the agreement they are comforted by the fact that you are comfortable with them looking at your proposal at every angle. Once they see that you have their best interests at hand when proposing what should appear to be a “win-win” collaboration of resources in your first few agreements your future partnerships will progress with less effort (22).


Italians will avoid being direct and often ignore your demands for an immediate acceptance or refusal of terms. It will be rare to hear host country partners use the word “No” during negotiations; instead, they will change the focus to a different part of the agreement or skirt away from business talks and ask about your family. Patience will become a daily mantra during your first year in Italy, without patience your business objectives will often fail to win the cooperation needed from your Italian counterparts. Compare the graphics below to gain a deeper understanding of the difference in the negotiating process (21).

(21)


DRESS CODE AND PERSONAL FASHION

Dress codes vary by region and climate; however, you can expect that your Italian coworkers invest a larger portion of their income in their clothing and spend a larger amount of time evaluating their wide range of potential outfits for the day at hand. At first glance you might be misled by the lower number of white shirt and tie dress codes than in the United States; however, if you look closely you may find that knit crew neck shirt is anything but a t-shirt, instead it could be a meticulously pressed merino wool knit that might cost several hundred dollars, the type of attire that Americans would save only for weekend social events.  For example, few American workers with salaries under $100,000 even consider purchasing a $500 pair of shoes or a $2000 handbag; however, it is common in Rome and Milan to notice that some junior level managers own several pairs of $500 designer shoes and a couple of $2000 bags, and what astounds most Americans is that they wear such expensive fashions to work on a daily basis. Forget about the American concept of “work clothes” being the ones that you are not concerned about getting soiled or torn. With that in mind, Italian business people take great care of their clothing, most items are professionally laundered after each day’s wear with the exception of wool suits which are usually hand steamed at home before returning to the closet. As for sneakers or sneaker inspired casual shoes, they are not often seen inside a business office, so when in doubt plan to limit your sneakers to the gym or the ballfield and the same can also be said of typical American jersey cloth sweat suits.

For women, take note that colored nails are uncommon, and makeup is light or often non-existent inside the workplace and is generally considered tacky and the hallmark of a stereotypical tourist. Instead of makeup, women invest their primping time into the preparation of their hair to achieve the best possible shape and shine. You will often be surprised as well to learn that even junior level females commonly spend $100 per week to have their hair care maintained by the countless number of highly respected salons across the major cities, in Milan stylists at the most elegant salons make over $100,000 year (19).


While women’s business attire might initially seem sexier than you might find in an American business environment, you will notice that it comes from Italian clothes to be form fitting rather than expose skin, so be cautious about the low-cut blouse or high hemmed skirt that is considered acceptable in American offices. You will later gain an overall perspective on where each culture places its discretionary income, when those Milan coworkers are shocked to learn that you had two $40,000 cars in your garage back in the United States at your pay level.


DINING ETIQUETTE

Italians take food very seriously, and take their time enjoying the food experience. When at a restaurant, it is not uncommon to spend several hours enjoying the company of those you came with. Expect to be at a restaurant for a minimum of 1-2 hours, possibly more, especially on Sundays. Each region, and sometimes even individual cities, have their own specialty dishes, so the best way to immerse yourself in the local culture is to ask your server about the specialties. A full Italian meal typically consists of an appetizer, a first course, and a second course with a side dish.

Most Italians drink mineral water and/or wine with meals and you can expect to see a charge on your bill even for tap water. Coffee is not served until after the meal. Italians usually eat late meals, where lunch will not start until approximately 1pm, and dinner not until 8pm. Nearly all shops and restaurants are closed for three to four hours between lunch and dinner; however, in large tourist areas, one may find restaurants open all afternoon. Because Italians spend significantly more time at restaurants than Americans, the server will almost never bring the bill to the table until asked to do so. In addition, table etiquette is similar to most countries in terms of utensil use. However, forearms (not elbows) should rest on the table, not on the lap, which is common in American culture.

Large tips are frowned upon in Italy; most wait staff are viewed as distinguished professionals and receive a respectable living wage salary. In most regions a “service fee” or table fee is included in on the bill which represents a built-in tip, in these situations it would be uncommon to leave an additional tip. Therefore, the most valued tip is enthusiastic praise to the chef and server. Ask your business associates for their recommendations on tipping practices in the area that you will be working, they will appreciate your concern for adapting your behavior to the local practices and be more willing laugh off any inappropriate mistakes made along the way.

GIFT GIVING

Italians like Americans have corporate restrictions on receiving gifts from vendors, so gifts are not expected from business associates, but are common when invited to a home for a dinner party. Typical gifts are inexpensive and often representative of your home country such as American liquors or chocolate, when in doubt flowers are suitable for any occasion, however avoid chrysanthemums which are used for funerals and never given an even number of flowers as it is considered bad luck.


REFERENCES

  1. Alm, J., Bernasconi, M., Laury, S., Lee, D. J., & Wallace, S. (2017). Culture, compliance, and confidentiality: Taxpayer behavior in the United States and Italy. Journal of Economic Behavior & Organization,140, 176-196. doi:10.1016/j.jebo.2017.05.018
  2. Business etiquette. (n.d.). Retrieved December 04, 2017, from http://businessculture.org/southern-europe/business-culture-in-italy/business-etiquette-in-italy/
  3. Cost of Living in Italy – International Living Countries. (n.d.). Retrieved December 04, 2017, from https://internationalliving.com/countries/italy/cost-of-living-in-italy/
  4. Curtis, M. B., Vinson, J. M., Conover, T. L., Lucianetti, L., & Battista, V. (2017). National Culture and Ethical Judgment: A Social Contract Approach to the Contrast of Ethical Decision Making by Accounting Professionals and Students from the U.S. and Italy. Journal of International Accounting Research,16(2), 103-120. doi:10.2308/jiar-51824
  5. Dining Out in Italy: How to Enjoy an Italian Meal. (n.d.). Retrieved December 04, 2017, from https://www.tripsavvy.com/eating-out-in-italy-1547406
  6. Doing business in Italy: 5 Tips for Foreigners. (n.d.). Retrieved December 04, 2017, from https://www.italybeyondtheobvious.com/tips-on-doing-business-in-italy
  7. Education and Transportation in Italy. (n.d.). Retrieved December 04, 2017, from https://www.internations.org/italy-expats/guide/living-in-italy-15326/education-and-transportation-in-italy-2
  8. Executive MBA IN Italy. (n.d.). Dictionary of Marketing Communications. doi:10.4135/9781452229669.n3250
  9. Hofstede, G. (2016, October 14). Country Comparison Italy vs United States . Retrieved December 04, 2017, from https://www.hofstede-insights.com/country-comparison/italy,the-usa/
  10. Inge, S. (2013, December 02). Six tips for Italian business etiquette. Retrieved December 04, 2017, from https://www.thelocal.it/20131202/six-tips-for-italian-business-etiquette
  11. Italian education system, italian schools, schooling in italy, Italian nursery school, primary schools in italy, italian middle school, high school, secondary schools in italy, vocational studies in italy, academic schools, Italian universities. (n.d.). Retrieved December 04, 2017, from https://www.understandingitaly.com/profile-content/education.html
  12. Italy Pros and Cons for an Expat Assignment. (2012, October 25). Retrieved December 04, 2017, from http://www.expatarrivals.com/italy/pros-and-cons-of-moving-to-italy
  13. Italy vs United States Cost of living Stats Compared. (n.d.). Retrieved December 04, 2017, from http://www.nationmaster.com/country-info/compare/Italy/United-States/Cost-of-living
  14. Local, T. (2016, February 17). Young Italian workers are among worst paid in Europe. Retrieved December 04, 2017, from https://www.thelocal.it/20160217/young-italian-workers-are-among-the-worst-paid-in-europe
  15. Miller, D., Breton-Miller, I. L., Amore, M. D., Minichilli, A., & Corbetta, G. (2017). Institutional logics, family firm governance and performance. Journal of Business Venturing,32(6), 674-693. doi:10.1016/j.jbusvent.2017.08.001
  16. Raspadori, P. (2011). Inequality and culture: geographical differences in the access to cultural enrichment in Italy (1863–1992). Continuity and Change,26(02), 219-241. doi:10.1017/s0268416011000105
  17. Rosch, D. M., & Haber-Curran, P. (2013). Learning Leadership Abroad. Journal of Leadership Education,12(2), 148-154. doi:10.12806/v12/i2/148
  18. Rosen, E., & Rizzo, G. B. (1961). Preliminary Standardization of the MMPI for Use in Italy: A Case Study In Inter-Cultural and Intra-Cultural Differences. Educational and Psychological Measurement,21(3), 629-636. doi:10.1177/001316446102100309
  19. Starr, G. (n.d.). Facts About Italy & Fashion. Retrieved December 04, 2017, from http://traveltips.usatoday.com/italy-fashion-13086.html
  20.   Expatriation: Why does it fail? (n.d.). Retrieved December 04, 2017, from http://www.expat-us.com/expatusblog-relocationusa/2014/9/2/expatriation-why-does-it-fail-
  21. Lubin, J. G. (2015, August 14). 23 fascinating diagrams reveal how to negotiate with people around the world. Retrieved December 04, 2017, from http://www.businessinsider.com/how-to-negotiate-around-the-world-2015-8/#italians-regard-their-languages-as-instruments-of-eloquence-and-take-a-verbose-flexible-approach-to-negotiations-6
  22. R. (n.d.). Negotiating styles in Italy. Retrieved December 04, 2017, from http://www.minorccbs.com/skills/negotiations/item/negotiating-styles-in-italy


Pharmaceutical Price Points – Pricing the EpiPen

epipenchart1

Marketing Case Study: Pharmaceutical Price Points – Pricing the EpiPen

Todd Benschneider – University of South Florida – Dr. James Stock

June 29, 2017


Introduction

Mylan Pharmaceuticals gained front page notoriety in 2016 for its part in sweeping allegations of price gouging and Medicaid abuses among large pharmaceutical companies. Consumer backlash to the rising costs of healthcare fueled a hailstorm of media attention, spotlighting Mylan’s unprecedented price inflation of several older generic drugs. The Mylan product at the forefront of the debate was the EpiPen; an emergency treatment device that assists patients in self-administering adrenaline (epinephrine) during severe allergic reactions. The device had grown into a household brand over the 30 years since its introduction and EpiPen’s brand loyalty provided the foundations for one of the industry’s most successful, and now most questionable, brand revitalization campaigns ever launched.  The marketing vision began in 2007 when Mylan Pharmaceuticals purchased the rights to the EpiPen brand inside a $6.6 billion packaged deal of 434 generic drugs from Merck Pharmaceuticals. Shortly after the acquisition, Mylan began increasing prices by increments of 10% per quarter until the EpiPen’s price had grown by over 600% in ten years that followed (Darden).


Mylan management defends the increases, claiming to have invested over $20 million in product and distribution chain improvements since acquiring the product (Koons). The firm’s executives cite that former owner Merck’s initial price of $94 per package generated a comparatively low 8.9% net profit in 2007. Defendants of the price increases also argue that price adjustments were necessary to create a sustainable supply chain of the lifesaving medicine (Lee).


The combined sum of those arguments were unable to pacify the critics after an investigative report by Ben Popkin of NBC news revealed that “from 2007 to 2015, Mylan CEO Heather Bresch’s total compensation went from $2,453,456 to $18,931,068, a 671 percent increase. During the same period, the company raised EpiPen prices, with the average wholesale price going from $56.64 to $317.82 per pen, a 461 percent increase, according to data provided by Connecture.” In a historical pricing perspective of the brand, Bresch’s salary increases alone increased the cost of manufacturing the EpiPen by nearly $5 per package; which, when contrasted to Merck’s original pricing, would have cost the product nearly its entire profit margin. The attention garnered by the compensation of CEO Bresch, along with the observation that over 40% of Mylan’s annual profits were now being generated by the EpiPen price increases, compounded Mylan’s public relations woes as a symbol of management’s greed, drawing nationwide criticism on executive pay excess and pharmaceutical anti-trust laws (Bastick).


Today Mylan has arrived at a strategic crossroads in its marketing vision. The firm’s 90% market share of epinephrine injectors will certainly be jeopardized if revised pricing fails to satisfy expectations of corporate responsibility, and the potential loss of the EpiPen market could cost stakeholders $847 million in annual earnings (Ubel). In addition, the brand collapse would generate a multi-billion dollar capital value loss of resale value of the brand. Since EpiPen’s patents will soon expire, Mylan’s original plan to sell off the division for a fast profit would be hampered by the devaluation of the EpiPen brand name, rendering the manufacturing facilities, goodwill and marketing capital worthless to prospective buyers.


Background

Unlike other pharmaceutical structure pricing bands, the EpiPen injector pricing was relative to the mechanical engineering patents contained within its dosing syringe system, rather than the chemistry of its medicine. The generic hormone solution inside the applicator has been widely available for years at prices less than $2 per dose; however, the precision, spring-loaded application syringes cost approximately $35 to manufacture. Critics claim that excessive marketing spending under Mylan’s management inflated the total cost to manufacture, market and distribute the device, from $80 to as much as $450 per package (Popkin). EpiPen had enjoyed a unique advantage in the drug market, because its mechanical design the EpiPen had been protected through engineering patents which were outside the pharmaceutical anti-trust regulations of the FDA (Darden). In addition, the arrival of new entrants to the market had been limited by the historically low profits earned by these injection devices (Lee).


The patents alone however, did not allow for a market domination, Pfizer had patented a rival product, the Adrenaclick, which was released for exclusive distribution through Wal-Mart in 2010. The new entrant, however, faltered due to limited brand awareness and its restrictive distribution exclusivity to Wal-Mart stores. In two years following its introduction, Adrenaclick failed to capture more than a 7% market share, despite selling at a price point of 1/3rd that of the EpiPens. In 2012 the maker of Adrenaclick sold off its manufacturing equipment and the product temporarily left the market, under the assumption that the timing was not right to continue challenging the EpiPen for market share (Bastick). Internationally EpiPen competed against a French rival the “Auvi-Q” which was sold in Europe at around $100 per package; however, Auvi-Q initially chose not to apply for U.S. distribution due to possible U.S. patent overlaps with some of EpiPen’s design. The continued existence of this international competition in the injector market remains the driving force behind why EpiPen prices in Europe have remained near their original 2007 prices, at around 1/5th the price of EpiPens sold in the U.S.


Much of Merck’s pre-2007 decisions for U.S. price points near the $100 mark were justified by the international price competition of the French Auvi-Q. Merck management believed that if U.S. market profits grew too lucrative, that Auvi-Q would challenge its U.S. patent rights, generating a legal battle that would cost years of EpiPen’s profits along the way. In addition to Auvi-Q, a new rival was introduced to the U.S. market in 2005 named Twinject which was marketed at a lower price point, at the time, than the $90 EpiPen. With pricing influenced by anticipated market competition of 2007,  the 25 year old EpiPen line had been generating less than $17 million in profits from about $200 million in sales. Even Mylan executives had initially planned to spin off the EpiPen line from its new portfolio purchased in the Merck deal (Koons). However, CEO Heather Bresch saw a golden opportunity for the product and persuaded the board of directors to use EpiPen as a sample case for the future marketing of its generic brands. Mylan took on a revitalization marketing campaign and set its sights on capitalizing on the remaining untapped profits from its captive mechanical syringe market (Koons).


Pricing the EpiPen was a great challenge, since strategies in drug pricing are deeply complex; pharmaceutical makers are faced with a more complicated marketing landscape than manufacturers of retail goods. Prices for the same drug can vary widely from one country to the next, for example an EpiPen is priced in Great Britain at $69, in Germany at $190 and in the U.S. at $600. This variation among pricing processes reflects the complexities of distributing a product to meet a variety of competitors and price-influencing criteria in each market. For example in the U.S. the FDA along with private insurers utilize a market driven price allowance, in the spirit of capitalism, a drug maker can charge nearly any price for its products, a policy that is intended to draw new entrants into the market and drive prices down and quality up. In comparison, many European countries require an approved “reference pricing model”, which dictates the fair insurance reimbursement value of a drug is based on the costs of its alternatives. Some countries such as France include negotiable “price band” restrictions that cap the maximum price the drug can be sold at as an allowable percentage over the lowest price which the company sells the drug in other nations. Because of these price regulations some pharmaceutical firms choose not to distribute their products in highly regulated markets such as France and Switzerland (Rankin).

In 2009, the anticipated arrival of new entrants to the market became a reality when French rival Auvi-Q applied for North American distribution. Auvi-Q was expected to challenge EpiPens U.S. patent rights; however, Auvi-Q withdrew from the U.S. market entry after a series of safety recalls crippled their brand’s market value, they too believed the timing was not optimal to challenge the EpiPen for market share. Bresch’s strategy flourished by the subsequent delay of new competitors to the market and EpiPen found a growing market, even at much higher prices. The CEO’s belief was, that through an increased profitability of the mature market, Mylan had created an incentive for competitors to join with their own rival products in the final years remaining, until 2025, when the EpiPen patents would expire. The resulting lucrative margins created by the new higher prices would provide an improved resale market for the EpiPen division or the future licensing of its technology (Koons).


Mylan expected that the new players in the market would quickly drive EpiPen prices back to near its original $90 per package through price wars. During the eight year period of price increases, EpiPens previously stalled sales volume, even grew by 67%.  Mylan had successfully expanded the existing market by lobbying for revisions to school medical restrictions which had prevented school staff from administering the shots to students in emergencies. With the restrictions lifted, Mylan further lobbied for tax subsidies to donate free EpiPens to schools, increasing goodwill and lowering corporate tax burden by $600 per package rather than the $100 per package deduction which would have been captured in the previous price formula. The theoretically deductible donations allowed Mylan to pay an effective 20% U.S. corporate income tax rate in 2015, saving it nearly $100 million in tax liabilities (Lee).


Bresch’s short-term strategy was directed at harvesting larger profits in the U.S. market through price increases, brand recognition and distribution expansion for several years until competitors could mobilize new products. From Bresch’s long term perspective, once that competition arrived to the market, Mylan could sell off the EpiPen brand and its soon expiring patent protection to the new competitors. However, in the eight years that followed the campaign launch, the anticipated competitive price pressure never materialized, as both Auvi-Q and Twinject suffered public relations problems and financial difficulties during the recession which caused both competitors to withdraw from the U.S. market by 2014. Capitalizing on the limited competition, Mylan increased prices by about 10% per quarter per year, gradually bringing the price from $90 per pair of EpiPens to over $600 per pair.


Alternatives

Mylan executives forecasted the introduction of EpiPen rivals by 2010, however the recession and other unforeseen regulatory factors delayed the arrival of that competition by nearly a decade. Bresch defends Mylan’s aggressive pricing strategy, justifying the tactics by capitalizing on the opportunity to harvest an additional $600 million per year in profits for every year that competition failed to materialize. Executives such as Bresch could claim a fiduciary obligation to the investors to exploit market gaps for shareholder gain and to pad the company cash reserves to fund new drug products (Koons).


In addition, Mylan leadership claims that they did not believe that they were creating a public safety crisis of affordability, because the allergic reactions could be just as effectively treated with an economical alternative which utilizes a $2 syringe and $5 vial of epinephrine. They pointed to the low switching costs of those alternatives and pointed to the examples of emergency responders that had converted back to dosing patients from syringes in addition to the arrival of free clinics which guided the uninsured on the creation of their own emergency kits for a fraction of the cost of a preloaded EpiPen (Rankin).


Mylan’s leadership could not have reasonably anticipated the market’s reluctance to self-dose from conventional syringes. Bresch initially believed that the primary competitive advantages envisioned for the EpiPen were limited to small children who could not administer epinephrine through syringes and to schools which were only protected from legal liability by using the EpiPen or an approved similar device (Koons). Regardless of price, consumer’s fear of incorrect dosing or injecting air into their bloodstream stalled the advancement of self-administered syringes (Bastick). The media scrutiny chose not to address that the EpiPen price should have little effect on affordable healthcare since it is viewed by medical practitioners as a simple convenience, rather than a medical necessity (Lee).


The lack of mounting competition for the past decade could not have been foreseen by management either, as three attempts at injector market entry by other firms failed due to poor timing or marketing. The introduction of a generic EpiPen competitor by Israeli firm Teva Pharmaceuticals was also denied by the FDA in 2016 further diffusing competitive influences. However, in late June of 2017, the FDA approved the next major player in the epinephrine injection market, Adamis Pharmaceuticals introduced their own injector under the brand name “Symjepi” a cheaper alternative to Mylan’s EpiPen, but expected to price higher the Adrenaclick (Bastick). Auvi-Q has also been approved to market their rival injector beginning in 2017 and Adrenaclick and Twinject have announced their returns to the market.

In response to consumer backlash and the coming arrival of generic substitutes, Mylan has announced that it will release a generic version of the EpiPen priced at around $300 per package of two. Analysts suspect that Mylan will continue to donate the EpiPen brand version to schools for a write off of $600 per package to maintain their tax savings and continue to promote the EpiPen brand to those whose insurance allows for brand name premiums. Despite the announcement, Mylan has not been quick to launch the distribution of its half priced generic alternative (Bastick).


Proposed Solution

The arrival of the new competitors, the aging patents, along with the media scrutiny makes a clear case for drastically reducing the EpiPen price. It stands to reason that competition among new firms will drive prices back down to the mid-$100’s per package or possibly even lower by 2025. The inevitable loss of EpiPen’s mechanical patent protection will soon render the brand’s competitive advantages obsolete. The EpiPen brand appears to have run its lifecycle and while the marketing tactics of Bresch succeeded at capturing an astounding quantity of remaining value from the brand; a change of course is needed to salvage the remains of Mylan’s public image and diffuse additional conflicts with lawmakers. The negative publicity around the EpiPen pricing is a driving force that pressured lawmakers to fine Mylan $465 million in 2016 for exploiting a regulatory misclassification to increase Medicaid reimbursement rates. It is likely that regulatory backlash will begin impacting the future FDA cooperation of Mylan’s other products. Continued friction between government regulators and Mylan could delay the FDA approval of more profitable new products and increase scrutiny into other areas of taxation and accounting regulations.

According to Porter’s five forces, over the next 10 years, EpiPen will suffer the fate of many other mature, low technology products which survived by the slight advantages of their distribution chain efficiency and became unable to grow and generate premium profits through technology advantages. For a firm such as Mylan, their interests would be best served by directing their focus toward the development of new products rather than expending administrative resources on the low-margin, maintenance of a supply chain distribution in a mature market.


Recommendations

Selling off the EpiPen brand and facilities to rival Teva Pharmaceuticals seems to be the most logical course of action. Teva’s acquisition of a widely recognized brand such as EpiPen would gain them access to the U.S. market which had recently been denied to them by the FDA’s rejection of their competitive product. The brand development value to Teva appears to exceed the future earnings potential of the EpiPen division to Mylan and could allow the firm to negotiate a premium sale price. However, there is some friction remaining between the leadership of both companies after Teva’s 2015 failed takeover attempt of Mylan.

The logical course of action, would be to advise Mylan’s CEO, Bresch, to contact leaders at Adrenaclick, Teva and Adamis to locate the highest bidder for the sale of the EpiPen brand prior to Mylan’s own launch of the generic version. By leveraging Teva’s offer, Mylan may be able to tempt either Adrenaclick or Adamis to pay a similar premium price for the brand. In addition, by delaying the generic marketing launch, a new competitor could capture the generic market by utilizing their own marketing campaign budget already allocated toward their entrance to the market. By allowing the new entrants to control the price band, the strategy could allow the entrants to more efficiently gain control over the adrenaline injector market, allowing the fewer remaining players to enjoy greater profit margins. It should be expected that EpiPen’s $800 million in annual profits will soon diminish back near the $18 million level of 2007 in the face of international competition and public scrutiny.


Conclusions

Mylan’s success at capturing untapped profit potential from a low-profit, mature market provided a valuable case study in both brand management strategies and an application of SWOT metrics. While the long-term brand potential remained limited, CEO Heather Bresch demonstrated great insight by capitalizing on EpiPen’s remaining market strengths and leveraged those strengths through marketing to exceed all foreseeable expectations of profit potential for the lackluster brand. Some analysts calculate that Bresch harvested more than three times the profits from EpiPen in the 10 years at the end of its patent protected lifecycle than the profits from all of the other companies combined, that owned the product along the 35 years that EpiPen was on the market (Koons).

The negative press would likely have been unforeseen by anyone, since the catalyst for the media scrutiny was originally aimed at Turing Pharmaceuticals and its outspoken CEO Martin Shkreli for their price hikes on lifesaving AIDS treatments. Mylan’s own negative press exposure was viewed by many as unjustified collateral damage, which brought an unfavorable spotlight on Bresch’s strategy and may have accelerated the entrance of new competitors which had been waiting patiently to exploit the optimum timing to reduce switching costs for consumers (Lee).

The public relations opportunity that Mylan probably missed was to demonstrate an empathy toward the uninsured by launching a parallel campaign to provide a package of free EpiPens a year to the uninsured or low-income underinsured customers, rather than their chosen direction of providing “$100 off” coupons that were limited only to those with commercial health insurance. Mylan’s disregard for the underinsured struck a nerve with the low-income masses and fueled the media frenzy that surrounded the executive pay scandals. The public relations damage to Mylan’s brand value and the resulting lack of political cooperation that will follow could be estimated to cost several billion dollars in the coming years as lawmakers begin to apply their own pressure by withholding cooperation and avoiding any compromises that appear to benefit Mylan.


Exhibit 4. Expert Financial Analysis

Martin Zweig Analyst Commentary on Recent Financial Performance of Mylan: Guru Score 62%

P/E RATIO: [PASS] The P/E of a company must be greater than 5 to eliminate weak companies, but not more than 3 times the current Market P/E because the situation is much too risky, and never greater than 43. MYL’s P/E is 38.62, , while the current market PE is 19.00. Therefore, it passes the first test.

TOTAL DEBT/EQUITY RATIO: [PASS] A final criterion is that a company must not have a high level of debt. If a company does have a high level, an investor may want to avoid this stock altogether. MYL’s Debt/Equity (128.91%) is not considered high relative to its industry (152.29%) and passes this test.


SOURCES

“10 New Years Resolutions for the Pharmacy Industry”. 2017. Medreps.com

https://www.medreps.com/medical-sales-careers/10-new-years-resolutions-for-the-pharma-

industry/

Bastick, Erin. 2017. “EPA Approves EpiPen Rival”. Formulary Journal.

http://formularyjournal.modernmedicine.com/formulary-journal/news/fda-approves-epipen-rival

Lee, Jaime. 2016. “Mylan CEO defends EpiPen strategy, questions pricing model in the U.S.” MMM   

         Online. http://www.mmm-online.com/commercial/mylan-ceo-defends-epipen-strategy-questions-        

          pricing-model-in-the-us/article/576448/

Koons, Cynthia. (2015). “How Marketing Turned EpiPen into a Billion Dollar Business”. Bloomberg

          Business Week. https://www.bloomberg.com/news/articles/2015-09-23/how-marketing-turned-

the-epipen-into-a-billion-dollar-business

Mattingly, Joseph. 2017. “Drug Price Wars, Episode VII: The General Assembly Awakens”. Mattingly  

            Report. https://www.mattinglymanagement.com/2017/02/generalassemblyawakens/

Popkin, Ben. (2016). “Mylan’s CEO Pay Rose over 600% as EpiPen Prices over 400%”. NBC News. http://www.nbcnews.com/business/consumer/mylan-execs-gave-themselves-raises-they-hiked-epipen-prices-n636591

“Pricing the EpiPen: This is Going to Sting”. (2016). Darden Business Publishing University of Virginia.

https://cb.hbsp.harvard.edu/cbmp/product/UV7186-PDF-ENG

Rankin, Peter. 2014. “Global Pricing Strategies for Pharmaceutical Product Launches”.

http://www.pharmaceticalpricing.com Sourced:

https://www.crai.com/sites/default/files/publications/Global-Pricing-Strategies-for-

Pharmaceutical-Product-Launches.pdf

Ubel, Peter. 2017. “What is Maddening About Pharmaceutical Prices”. Forbes. 

          https://www.forbes.com/sites/peterubel/2017/04/28/what-is-maddening-about-pharmaceutical-

prices/2/

Zweig, Martin. 2017. “Mylan Guru Performance Assessment”. NASADQ.

http://www.nasdaq.com/symbol/myl/guru-analysis/zweig#anchor2


A Comparative 360 Degree Performance Assessment of 4 of the World’s Largest Tire Manufacturing Companies: Triple Bottom Line Case Studies

Todd Benschneider, Marie Larose, Kyria Perez-Serrano, Hailey Smith, Daniel Villa

University of South Florida, 10 November 2016


Table of Contents


Industry Overview………….…. 2

Economic Assessments.……… 4

Social and Environmental Assessment………………..……21

Concluding Remarks..…..…… 36

Works Cited…………………….. 37


Industry Overview

For our assessment, we chose to take an in-depth look into the tire industry. Drawn to the topic because of the industry’s large carbon footprint per unit sold and its historic reputation as an environmental polluter of PVC manufacturing byproducts, which have been linked to liver cancer in tire plant workers. 

The impact of worker PVC exposure has been well studied and in response to that research, the EPA has regulated the manufacturing process and the industry has taken subsequent action to reduce PVC vapor exposure (Criswell 3). 

Tire consumption is not considered to be an optional luxury good in industrialized countries; therefore, eliminating tire use is not currently a realistic goal; therefore, creating a long term sustainable plan for the industry is imperative. 

Since rubber product manufacturing is a mature industry dominated by a handful of large multinational companies, it therefore represents an ideal topic to study as an application of well-developed pollution control policies.

The biggest obstacle that we encountered in our U.S. industry choice was the fact that two of the largest companies in the industry were not U.S. based firms. 

Michelin, a French based firm, and Bridgestone, a Japan based firm, are both companies that have bought nearly all the major American brands (i.e. Firestone, Uniroyal, and BF Goodrich) in order to gain North American facilities in their pursuit of global expansion (Goodyear Tire…SWOT Analysis 3). 

We did, however, secure permission to include these companies into our research due to the fact that they are traded on either the NASDAQ or NYSE, and both have published detailed reports for their American shareholders.


FIRM SELECTION: GOODYEAR TIRE COMPANY

We chose to narrow our research focus to the Goodyear Tire Company because it is the largest U.S. based tire manufacturer. 

Based on conclusions drawn from older news stories about the company and previous MSCI ratings, it appears that Goodyear had been a laggard in social and sustainability issues over the previous 30 years; however, more recently the company has sought to reinvent its public image in 2010 with the launch of a strategic initiative on environmental and safety concerns (“Goodyear Tire…SWOT Analysis” 17).

While Goodyear has advanced upward in the MSCI ratings, it still falls behind its two major foreign competitors, Bridgestone and Michelin, in most environmental categories. Goodyear also scores a very distant last place ranking in financial performance among the top five tire companies in their 2015 financial reports. 

Despite the poor financials, most stock analysts still recommend Goodyear stock as “undervalued” or as a “long-term buy,” which indicates that analysts believe the current financial condition is temporary and improving (“Goodyear Pumped with Tire Profits” 1).


Economic Assessment

In the most recent 2015 annual reports, Goodyear was the poorest performer in its industry, and appeared to have fallen dramatically in comparison to its previous four years.

However, most of the 2015 change in financials is attributed to Goodyear’s decision to write off one of its largest tire manufacturing plants located in Venezuela where operations have been disrupted by currency and political instability. The company will retain ownership of the facility, but political instability will prevent the liquidation of the assets which will be written off in their entirety for the 2015 reporting year. Future sale of assets will be applied as capital gains to the year of sale.

Financial Times writer Pan Kwan Yuk summarized the Venezuelan liability in an article titled “Goodyear takes $646m hit on Venezuela” in the February 9th, 2016 edition of The Financial Times in his description of the events:

“The economic meltdown in Venezuela continues to blow holes across the balance sheets of corporate America, with Goodyear, the US tire maker, the latest to announce a substantial write-down to its business there.

The company said it took a $646m hit during the fourth quarter after it moved to deconsolidate its Venezuelan business from its financial statements. The write down pushed Goodyear into a loss of $373m for the December quarter, compared to a profit of more than $2.1bn a year earlier.

Excluding the Venezuelan write-off, net income came in at $257m.

Major US companies with exposure to Venezuela – including Procter & Gamble, Colgate-Palmolive, American Airlines, PepsiCo, AT&T and Ford Motor – have been collectively forced to take billions of dollars of write downs in recent years as Venezuela’s currency problems accelerate.

Unlike bleach maker Clorox, which exited Venezuela altogether 16 months ago, Goodyear said it continues to maintain manufacturing and sales operations in the country.

But like its peers, it has decided deconsolidate and write off nearly all of its cash and investment there amid little sign that it would be able to take the cash out of the country. The move comes as soaring inflation and the fast depreciating bolivar render the value of its bolivars lower by the day. Foreign currency exchange losses related to the Venezuelan bolivar fuerte came in at $34m for the 2015 year, Goodyear said.

Goodyear generates nearly half of its revenues from outside North America and the collapse of a number of major developed and emerging market currencies against the dollar has sharply eroded the value of its sales in those countries. Sales for the fourth quarter were $4.1bn, compared to $4.4bn a year ago. “Sales were impacted by $339 million in unfavorable foreign currency translation,” the company said in a statement. Shares in Goodyear, up 4 per cent over the past 12 months, were largely unchanged in pre-market trading.”

Despite its most recent financial results, many stock analysts see retained value that was built over the most recent five year performance and strongly recommend purchasing the undervalued Goodyear stock throughout most of 2016. In fact, over the past eight years Goodyear stock price has increased by over 500%. However, much of those gains were actually recovering stock price that was lost in the financial crisis of 2008, and has only recently returned to its 2007 price peak after the stock split of 1999. Despite the excellent 12 month performance of both Bridgestone and Michelin, both Goodyear and its U.S. peer Cooper tire have superior 5-year stock price increases.

For Example, on September 28, 2016 ETmarketwatch.com included Goodyear Tire in their article titled “These are the Nine Most Beloved Stocks on Wall Street Today” by describing Goodyear’s future potential:

“You might not always trust Wall Street analysts, but their views on stocks can be useful. For one, you can see which companies they favor. And, second, which shares might still be undervalued, given the seven-year-plus bull market in U.S. stocks.

The games that companies and sell-side analysts play with quarterly earnings — lowering expectations to set up “earnings beats” — hurt the credibility of analysts. Their reputations also are hurt by their tendency to avoid putting “sell” recommendations on stocks. In fact, as of the close of trading Sept. 20, not a single S&P 500 SPX, +0.08%  stock had majority “sell” ratings, according to FactSet.

But if you speak to a Wall Street analyst about an industry or a company, he or she will show impressive expertise and be able to justify his 12-month “buy,” “sell” or “hold” ratings pretty easily. Over the long term, analysts are also influential over stock prices as their consensus earnings estimates rise or fall.

Analysts often recommend buying shares of a company because the current stock price is considerably lower than where they think it should be, based on earnings and sales growth, cash-flow generation or other metrics. So there can be a great deal of logic behind a “buy” recommendation.

So we are listing, below, the stocks that are getting the most love from analysts. It might surprise you that there’s not a single stock among the S&P 500 with 100% “buy” or equivalent ratings. But here are nine with at least 90% positive ratings among analysts:

Figure 1- FactSet Stock Analysis


Figure 2- Consensus Recommendations

All the stock analysts’ recommendations on Goodyear we found in November indicated that around $30 per share of the stock is undervalued and on average support the data posted by Marketwatch. Reuters.com posted this summary graph from November 24, 2016 supporting Marketwatch’s claim that nearly all analysts expect Goodyear stock to out-perform the market in coming years.

Some analysts also explain that since tire manufacturers stock prices are volatile by comparison to the S&P 500 due to their reliance on rubber plantation yields, which are often impacted by weather, currency fluctuations and political news. With that level of volatility, tire companies stock prices typically trade at a discount to their earning potential when compared with other less volatile industries (“Sweet Spot” 1). However, while automotive component manufacturer stocks are performing well, the surprising discovery was that Michelin and Cooper, who posted superior returns on their 2015 earnings statements, both have lower stock purchase recommendation than do the frontrunner Goodyear and close second place Bridgestone.

2015 Annual Tire Revenue in Billions USD
Goodyear Bridgestone Michelin Cooper
16 27.1 22 2.9


Of large rubber companies, there are inconsistent rankings among the largest companies. Some rank by corporate revenue, including non-tire, and some even have substantial revenue generated by non-rubber products. For example, in overall revenue, including all subsidiaries, Goodyear is the world’s largest. However, by tire revenue, Goodyear ranks a distant third in revenue from tire sales and Bridgestone leads world tire revenue.

2015 Global Tire Industry Market Share
Goodyear Bridgestone Michelin Cooper
13.8% 23.4% 19% 2.5%


The global tire market demand creates a $116 billion per year industry, of which Japanese Bridgestone captures nearly a quarter of with Goodyear distantly trailing at about 14% global market share.

Current Ratio
Goodyear Bridgestone Michelin Cooper
1.24 2.17 1.91 3.08


Goodyear’s current ratio at 1.24 is the lowest of the Big 4 Tire Companies, but still within a healthy range for auto component firms. Cooper Tire is the leader in the above financial performance metric.

Quick Ratio
Goodyear Bridgestone Michelin Cooper
.74 1.5 1.06 2.13


Goodyear’s liquidity, a metric that serves as a precursor to a firm’s potential, inability to pay its current liabilities, as evidenced by the quick ratio, shows that Goodyear is the least liquid of the Big 4 Tire Companies at a .74, which is considered to be financially unsound at levels under 1.0. However, analysts must view this as a temporary result of the Venezuelan deconsolidation and, in spite of the liquidity report, recommend investing in Goodyear (Kwan Yuk 1).

Cash Ratio
Goodyear Bridgestone Michelin Cooper
.3 .72 .36 1.17


Goodyear’s 2015 cash ratio is the lowest of the Big 4 Tire Companies at .3, with a near tie to Michelin at .36. What seems surprising is that Cooper indicates excellent cash availability, possibly due to the lack of an aggressive growth strategy.


Debt to Equity Ratio
Goodyear Bridgestone Michelin Cooper
1.46 .1963 .2881 .316


Again, Goodyear ranks last in the financial performance metric of debt to equity ratio coming in at 1.46 in comparison with its three industry peers, which all have ratios under .32. However, mention is made by analysts that Goodyear’s accounting system regarding their underfunded pension is the factor that skews this metric. Financial analysts suggest that the average U.S. firm has a debt to equity ratio around 1.5, so Goodyear’s performance is not necessarily out of align with other industries, but their debt level is mentioned in the SWOT portion of their annual report as their greatest weakness.

Long Term Debt to Capital Structure
Goodyear Bridgestone Michelin Cooper
52.91 16.64 18.91 23.0


With regards to long term debt to capital structure, once again, Goodyear distantly trails its top industry peers with a ratio of 52.91:1, in comparison to the other end of the spectrum where its rival, Bridgestone, is much less risky in its structure at 16.64:1.

Debt to Assets Ratio
Goodyear Bridgestone Michelin Cooper
35.01% 11.63% 18.91% 12.7%


Goodyear again trails its industry peers with its debt to assets ratio, with 35.01% of its assets financed by debt, where its top industry peers have healthier ratios from 11.63% to 18.91%, another indicator that suggests that Goodyear does not have the financial health and stability of its peers.

Return on Assets
Goodyear Bridgestone Michelin Cooper
1.78% 7.33% 5.01% 8.64%


With regard to return on assets, Goodyear continues to lag behind its peers. However, analysts explain that if the Venezuelan deconsolidation had not been charged to 2015, the return on assets would have been around 6% (Kwan Yuk 1). One notable observation here is that American rival Cooper, who will later be discounted for poor corporate citizenship scores, shines on this primary measure for generating profits, which suggests the possibility that critics of environmental policies and reporting of the top three who score high on corporate citizenship measures may be at a cost of several percent of return on assets over the short term, and might influence executives to discount the priority of environmental issues.


Return on Equity
Goodyear Bridgestone Michelin Cooper
8.15% 13.26% 12.21% 23.34%


Goodyear’s 2015 return on equity performance also lags behind its industry peers at 8.15% in contrast to its U.S. rival and citizenship laggard Cooper Tire with a return nearly twice as much as the Big Three Tire Companies at 23.34%, which again might reinforce some skeptics’ views on the profitability of corporate sustainability objectives.

Return on Sales
Goodyear Bridgestone Michelin Cooper
10.04% 13.6% 5.47% 14.19%


Goodyear ranks third place out of four in return on sales at 10.04%, with corporate citizenship laggard Cooper leading this profitability factor at 14.19%.

Earnings Per Share
Goodyear Bridgestone Michelin Cooper
1.14 1.64 1.39 3.73


Goodyear ranked last out of four in earnings per share, with once again environmental laggard Cooper at more than double the second place Bridgestone.


Earnings Per Share Growth
Goodyear Bridgestone Michelin Cooper
-87.51% (5.43%) 13.77% .718%


In the easily skewed benchmark of earnings per share growth, Goodyear plummets from the other top three tire companies by reporting earnings 87.51% lower than the 2014 annual report. This is also highly influenced by the write off of its investments in Venezuela. Michelin posted improved earnings per share and Cooper stayed nearly on pace with 2014 earnings.

Price to Earnings Ratio
Goodyear Bridgestone Michelin Cooper
25.56 12.1 15.9 9.3


In terms of stock price value, Goodyear’s 2015 report shows a distant 4th place out of the four largest tire companies with a stock price of 25.26 times of every dollar earned, where Cooper stock represents the opposite spectrum where stock is valued at only $9.30 for every dollar of reported annual earnings. This ratio on the surface would not seem to support analysts’ purchase recommendation for Goodyear, however the record low earnings of 2015 as Goodyear wrote off $646 million dollars of Venezuelan assets skewed the single year earnings (Kwan Yuk 1).

Growth in Share Price
Goodyear Bridgestone Michelin Cooper
(11.8%) 9.68% 6.84%

(5.2%)


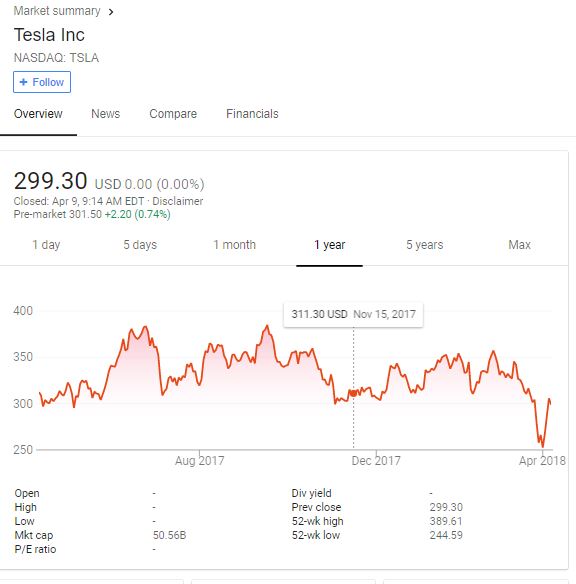
Figure 3- Goodyear 5 yr Stock Price Chart – Marketwatch.com 11/24/2016

Along with the previous influence of the Venezuelan write off, the 2014-2015 share price growth for Goodyear ranks it a distant last place among the Big 4 tire companies at -11.8%, where on the other end of the scale Bridgestone’s stock prices climbed 9.68% in the same year.

5 Year Average Growth in Share Price per year
Goodyear Bridgestone Michelin Cooper
51.8% 32.2% 43% 59.3%


However, as evidenced by the above 5-year graph of Goodyear stock, it becomes more apparent why analysts are recommending clients to buy Goodyear stock. It can be seen that over the previous five years Goodyear stock values have increased by an average of 51.8% per year, and recent negative financial data is quite likely limited to a single non-recurring economic anomaly of the Venezuelan deconsolidation, which should have a beneficial effect on 2016 and future financials that will no longer be reduced by continued losses from the sinking Venezuelan location (Kwan Yuk 1). While both Michelin and Bridgestone post more stable financial condition than Goodyear, those competitors are inferior in shareholder value enhancement over the past 5 years. However, it once again needs to be noted that Corporate Citizenship laggard Cooper leads the Top 4 by a sizable margin in this measure of profitability.

Asset Turnover
Goodyear Bridgestone Michelin Cooper
.95 .98 .92 1.2


In the asset turnover benchmark, Goodyear ranks third of four among closely scored competitors at .95. This area most likely was improved by the write off of Venezuelan assets. Once again, it must be noted that the leader of this metric is the laggard Cooper as its efficiency generating sales from its assets is 1.2.

Equity Turnover
Goodyear Bridgestone Michelin Cooper
3.96 1.753 2.07 3.38

Goodyear did show top industry performance in equity turnover as they generated $16.40 of revenue in 2015 from only $4.142 billion in shareholder equity for an equity turnover ratio of 3.96, in comparison to Bridgestone which only managed to double its assets worth in annual sales. This benchmark provides some insight to the majority of financial analysts who are bullish on Goodyear’s future stock value.

Revenue Growth
Goodyear Bridgestone Michelin Cooper
(2.02%) 3.17% 8.42% (13.2%)


In the 2015 year-over-year revenue growth, Goodyear ranked third of the Big 4 at 2.02% loss in revenue from the 2014 annual report. This could be partially attributed to when the income from Venezuela was no longer being measured. This is the first major financial benchmark where Cooper had fallen to a distant fourth place. As little as year-over-year performance might actually mean, Cooper’s loss of market share may be attributed to the launch of high tech fuel efficiency and electricity generating tires being patented by its three rivals, where Cooper has not yet become a player in this tire technology design.

Five Year Average Revenue Growth
Goodyear Bridgestone Michelin Cooper
(2.68%) 5.78% 3.45% (2.42%)


Figure 4- Goodyear Growth Chart from CSImarket.com 11/24/2016

Five year average revenue growth is a more reliable indicator of management and industry performance. Here, Goodyear scores at an average annual loss of 2.68%, roughly a 15% decline over half the decade. However, Goodyear had been purposely exiting some tire markets and selling off lower profit lines to concentrate on high value tires and focus on its electricity generating electric car tires, which is later evidenced by its five year increase in profit margins. Here again, Cooper’s lack of investment in high value technology tires is most evident as they may maintain on units sold, but lose out on premium priced tires to inherit the low price leftovers of the Big 3. Bridgestone, which has expanded more deeply into heavy equipment and agriculture lines, taking up some of Goodyear’s void left after their exit from some of those lines, increased in sales revenue by nearly 30% over the past three years from its product line expansion (Pierce 1). Michelin gained about 15% in sales from its expansion into low rolling resistant tires for the hybrid and electric car markets.

Stock analyst buy recommendations may also be influenced by patents that Goodyear has applied for in a tire design that harnesses the heat generated from hot roads and friction, and converts it into electricity for hybrid and electric vehicles (“Tech News: Goodyear Unveils Electric Car Tires” 1). The technology is performing well in testing, and if manufacturing costs can become competitive on the designs, then the value of licensing the technology will become even more valuable than producing the actual tires, and would have a very positive effect on Goodyear stock prices. Alan Pierce wrote an industry reaction to the release of the prototype in the 75th issue of Tech Directions (2015) in an article titled “The Goodyear BHO3–A Car Tire That Generates Electricity.” The following summary:

“The Achilles heel of all electric vehicles is how far they can travel before their batteries need recharging. At the 85th Geneva International Motor Show, The Goodyear Tire and Rubber Company unveiled their BHO3 prototype tire. This tire has a built-in electricity-generating system that can partially recharge the batteries on an electric vehicle without breaking any of the laws of thermodynamics. To avoid breaking the laws of thermodynamics, their tire breakthrough has to generate electricity without changing the amount of energy used by the electric motor during the normal operation of the vehicle. Without changing how much energy it takes to roll the tire, the BHO3 prototype turns tire heat and tire deformation—which are caused by the normal rolling of the tire—into electricity. Tires are usually designed to run as cool as possible. Goodyear has intentionally designed this tire to run as hot as possible to maximize the amount of heat available for conversion into electricity. This tire is designed to absorb heat even when the car is parked. So even if the car isn’t running, its hot tires will be generating electricity to charge the car’s batteries. All ambient heat is converted into electricity by a thermo-piezoelectric layer that covers the full internal surface of the tire. Getting the tires hot is a priority, so the outer shell of the tire has a special black texture specifically designed to absorb sunlight and convert it into heat. The tread is also designed to absorb and transmit heat, created by the friction of the road surface, to further raise the tires’ temperature. Goodyear system that keeps the outer temperature of the tire reasonable while it is extremely hot inside. The goal here is to not melt the blacktop on the road’s surface or burn a person’s hand if they touch a tire. Goodyear’s goal is to get every bit of otherwise wasted energy converted into electricity. To convert the physical deformation of the tires where they touch the road, Goodyear built a separate piezoelectric layer that converts into electricity the physical flexing of the tire as it rolls. These tires are extremely rugged and they can run safely at 50 miles per hour for up to 50 miles even after suffering a puncture. Photo 2 shows what the Goodyear BHO3 prototype tire display looked like at the Geneva Switzerland International Motor show. You can view a video introducing the BHO3 at http://www.youtube.com/ watch?v=ViMqrtq4aYg. The Goodyear press release that I received did not indicate how the electricity will be transferred from the tires to the batteries, how much electricity the system can generate, or how soon this prototype tire will find its way into commercial use. However, down the road, when it is introduced it might increase the range of the all-electric vehicle enough to make the all-electric vehicle practical.”

The growth potential for electric automobiles could disrupt the 100 year old auto industry once consumer demand for electric models snowballs or once legislators increase tax penalties on combustion powered vehicles. Either way, non-combustion powered vehicles appear to be drawing near on the horizon, and companies that continue to invest in development of gas powered models may find themselves left behind when the change takes place. Goodyear had already lost first mover advantage in 2006 for low rolling resistance passenger car designs to Michelin, but came back in 2010 to patent unique technology to become the low rolling resistance pioneer in heavy truck tires in their recently released “Fuel Max” line that has analysts bullish on Goodyear’s stock performance.

To help detail Goodyear’s logic behind the contradictory financials, Dow Theory Forecasts published this article in on September 12, 2015 titled “Goodyear Pumped with Tire Profits” with the following explanation:

“Formed in 1898, Goodyear Tire & Rubber ($30; GT) initially sold bicycle and carriage tires, horseshoe pads, and poker chips. By the 1980s, Goodyear had grown into a bloated conglomerate that built wheels, aircraft canopies, and even dabbled in gas pipelines. Today those businesses not related to rubber are long gone, as Goodyear has refocused on its core operations. New tires accounted for 87% of Goodyear’s revenue last year, the remainder coming from rubber-related chemicals and about 1,200 tire and auto-service shops. Goodyear tends to be a jittery stock, with exposure to the highly volatile market for synthetic and natural rubber. For now, commodity-price trends tilt in Goodyear’s favor. The company’s raw-material costs fell 9% last year and are projected to decrease 12% in 2015. The stock’s volatility seems well discounted in its price. In Quadrix®, Goodyear scores in the cheapest quintile for price/sales, price/cash flow, and price/earnings ratios using both trailing and estimated current-year profits. At 11 times trailing earnings, the stock trades in line with its 10-year average. Goodyear, earning a Value rank of 95 and Overall rank of 98, was initiated in the June 29 issue as a Long-Term Buy.

Prizing profits over sales have declined 7% to 8% in each of the past three years, hurt by foreign-currency headwinds, weaker pricing, and soft volumes. But Goodyear has a knack for wringing more profits out of less revenue. Net income has surged in recent years on lower raw-material costs and the divestment of high-cost plants. In 2014, Goodyear posted its highest operating profit margins since 1996. Encouragingly, tire volumes are starting to improve. Goodyear’s volumes rose 2% in the March quarter, and the company projects a gain of 1% to 2% for the year. Moreover, Goodyear announced in June plans to dissolve a venture that involved joint ownership of Dunlop branded tires in the U.S., Europe, and Asia. Goodyear will pay a net price of $271 million to take full control of the venture in Europe, divest the North American venture while still retaining the right to sell Dunlop tires in most markets there, and gain full ownership of the Goodyear brand in Asia. As a result, Goodyear expects annual revenue to decline by $100 million, though per-share profits should rise $0.15 to $0.18 due to the reduction in non-controlling interest expense. Operating cash flow totaled $1.62 billion for the 12 months ended March, nearly five times higher than the prior 12-month period. Goodyear has also generated $651 million in free cash flow over the past year.

Investors may have to wait until 2016 for sales to begin growing again. But Goodyear continues to improve efficiency, last month announcing plans to shutter a plant in England and move operations to lower-cost regions. The consensus calls for 5% higher per-share profits in 2015, despite 9% lower revenue.”

The article encapsulates the perspective of stock traders who see great future value in the Goodyear Company based on past ability to overcome adversity and adapt to economic change. Many stock traders see Goodyear’s recent setbacks as an opportunity to obtain the stock for a discount.


Social and Environmental Assessment

Goodyear has a global stake in community engagement, and their personal social assessment of the company is broken down amongst four different categories: Safe, Smart, Associate Volunteerism and Sustainable (“Community Support”). The grant programs that Goodyear has set in place are meant to better the community as it applies to each of the four categories. These grants are part of the Goodyear Better Future platform.

Safe: This category encompasses finding support for safe travel and mobility within communities. Along those lines, Goodyear has four programs in place worldwide. The Safe Mobility Program (which is detailed further in the sustainability report below), the Safe Way to School project in Poland that helps teach first graders safety while walking to school, the Rainy Season Awareness campaign in Guatemala that helps prep drivers for travel in the rainy season, and Race Collaboration in Spain that teaches road risk prevention and responsible road behavior (“Safe”).

Smart: This area includes supportive programs for adults and children in the hopes of educating and inspiring creativity and innovation. Along with the STEM programs detailed later in the report through the sustainability report section, Goodyear has two other programs including the Student Environmental Program in Turkey that gives university students field-based training on environmental support for the future, and the Hope School Project in China that gives students a positive educational environment (“Smart).

Associate Volunteerism: Goodyear encourages its associates worldwide to get out into the community and get involved. They have established programs such as the Hand in Hand program in Slovenia that connects schools through social media, and the safe driving Road and Tire Safety Campaign in Indonesia (“Associate Volunteerism”).

Sustainable: Goodyear has many programs set in place to assure that environmental protection is a key driver for the company. The “Pay Attention! To The Environment” Campaign, which they started in 2010, involves a waste-management collaboration between 60 institutions to reduce high school carbon footprints in Slovenia. Brazil recently received the Goodyear company sustainability award for conservation, in Thailand received the country’s Environmental Good Governance award, and two plants in Turkey held a drawing contest to fill their yearly calendars with images drawn by children highlighting environmental safety and protection. These are all instances of good environmental sustainability efforts that Goodyear is proud to highlight (“Sustainable”)

The Goodyear Foundation is another program designed to fit alongside Goodyear’s social responsibility strategies, but this program focuses on individual funding efforts whereas the others are more community support focused.

GREENWASHING AND BLUEWASHING CLAIMS

Despite Goodyear’s below industry average current “BB” MSCI ratings, the company appears to be growing into a good corporate citizen based on the five year score improvements against higher scoring industry peers. Due to stricter regulations in their home countries, both Bridgestone and Michelin have a longer history of environmental stewardship policies. Goodyear and it U.S. rival Cooper are the only companies from the top five world tire manufacturers that are not members of the United Nations Global Compact. Instead, Goodyear has adopted the lightly regarded WBCSD (World Business Council for Sustainable Development), as well as the WRI (World Resource Institute) environmental impact reporting standards, and Cooper refuses to disclose sustainability reports (“Goodyear 2015 Annual Report” 42-44).

In addition to lack of GRI reporting, Goodyear also could be considered to be greenwashing its efforts since does not use an outside environmental audit firm to verify its impact reports. Among its industry peers, Michelin enjoys a recently upgraded “A rating” on its proprietary impact reporting system, and only “BBB” rated Bridgestone, BB rated Continental and B rated Pirelli utilize independent auditors to verify their environmental impact claims.

Despite Goodyear’s 2015 third place ranking in the big three tire companies, a look at the past three year’s ratings show that, in recent years, Goodyear had been close to the first place with its B and BB rankings in three of the past five years. It should be noted that in the most recent two years, all three tire companies upgraded by one or two grades in MSCI ratings.

The Goodyear website and annual reports have large sections dedicated to publicizing their corporate citizenship goals. Many of these goals seem to be conservative when compared to environmental activist firms like Patagonia or Interface. However, Goodyear received worldwide accolades for its seven consecutive years of zero Landfill success. As taken from Goodyear’s own website, here is the abbreviated front page summary of their 23 pages of corporate citizenship goals and policies.

GOODYEAR’S 2015 SUSTAINABILITY REPORT

“ENVIRONMENTAL STEWARDSHIP

Sharing the planet responsibly with customers, employees, shareholders, communities and suppliers is the impetus behind key sustainability objectives at Goodyear. Our sustainable activities mirror this commitment.

21 Species of plants and animals protected on site of new Goodyear plant in Mexico.

While a site survey for Goodyear’s new plant in San Luis Potosi identified only a single cactus as a protected species in Mexico, 20 other plants and animals were recognized as protected by the Convention on International Trade in Endangered Species of Wild Flora and Fauna (CITES). These species are not endangered or facing extinction, but their survival requires special consideration. As a company committed to caring for our environment and communities, Goodyear relocated all to safe and compatible habitats.

510,731 GHG emissions reduction in metric tons compared to 2010, our baseline year. In 2015, Goodyear exceeded a five-year goal of reducing greenhouse gas (GHG) emissions by 19%. Part of our strategy to reduce GHG emissions is to address the entire lifecycle of our products, including reducing emissions from supplied materials through manufacturing, during use and final end of product life.

23% water use reduction since 2010, our baseline year. While the majority of Goodyear’s manufacturing facilities are in areas unaffected by water scarcity concerns, it is still important to us that we continuously reduce our impact on local water resources. We have reduced our water use by implementing leak detection programs and water conservation strategies, and investing capital into water reuse and treatment systems at select facilities.

15% reduction in energy consumption since 2010, our baseline year. In 2015, Goodyear achieved its five-year goal of reducing energy consumption by 15%. Each of our regions has a full-time energy manager engaged in implementing steps to reduce the use of energy in our facilities around the world.

38% solvent reduction in the last five years. Goodyear continues to be an industry leader in efforts to reduce solvents in our manufacturing facilities. Our use rate in 2015 was 0.69, a further reduction from 2014. Our focus remains on the global application of best practices to further reduce this rate.

0% amount of waste any Goodyear manufacturing facility is permitted to send to a landfill. For the past seven years, Goodyear has maintained Zero Waste to Landfill, a program that applies to all manufacturing facilities. This corporate initiative reduces our environmental impact by requiring all manufacturing plants to reduce, reuse and recycle waste.

OUR PEOPLE

At Goodyear, we are one team working together to drive performance on the road, in the marketplace and throughout the company. To reach our full potential as associates and deliver on business goals, we strive for five interdependent behaviors: Act with Integrity, Promote Collaboration, Be Agile, Energize the Team, and Deliver Results.

65,000 + employees Completed compliance and ethics training events. Associates around the globe completed online and in-person training events on topics such as the Business Conduct Manual, anti-bribery, competition laws, financial integrity, conflicts of interest, privacy, and protecting company information.

4= Current number of Employee Resource Groups.

Employee Resource Groups (ERGs) benefit Goodyear associates by providing access to invaluable coaching, mentoring, professional development, training and seminars, as well as opportunities to expand their professional network within the organization. In 2015, Goodyear had four ERGs —Goodyear Veterans Association, Goodyear Women’s Network, Goodyear Black Network, and Next Generation Leaders. Goodyear has plans to add another ERG in 2016 to promote diversity and inclusion.

66,000 Associates around the world.

We encourage a culture where associates own their own development and managers provide opportunities, coach and support their people throughout the development journey. Our leaders are held accountable for inspiring their teams, growing the business and acting with integrity, and their own talent management by honoring their commitments to associates.

HEALTH, SAFETY & WELLNESS

At Goodyear, we continue to build a culture where safety and wellness are values to each and every associate. By doing so, we will continue our drive toward zero incidents.

36% Injury reduction in the past five years. At Goodyear, our goal for safety performance is for every Goodyear associate around the world to go home injury-free every day. Our ultimate goal is for zero incidents. Examples of this focus include programs such as Target Zero, which focuses on near-miss reporting, and our global audit program that helps us strive for full compliance and continuous improvement in our environmental, health, safety and sustainability systems.

18 Health and wellness program and communications channels in place. Goodyear’s wellness initiative for associates, GoodLife, provides the information, tools and programs that foster an atmosphere of wellness and promote a culture of health at Goodyear. A new channel, the GoodLife app, is scheduled to launch in 2016.

OUR INNOVATIONS

Innovation excellence drives our technological advances and enables us to create products and services that are valued and sought out by consumers and customers. Our solutions respond to the needs of an increasingly complex market and help to set us apart from the competition. Innovations our customers want and need.

Innovative Tires: Among other important attributes, Goodyear conducts research to make tires environmentally friendly and fuel efficient in a variety of ways, such as by reducing tire weight. For example, Goodyear is the first manufacturer to incorporate silica derived from rice husk ash into its tires. Aside from making tires more fuel efficient, this innovation has the potential to eliminate millions of tons of rice husk from the waste stream. Visit our Corporate Responsibility website for more information about our award-winning innovations.

SmartWay®-verified products on the roads.

A total of 21 Goodyear truck tire products that increase fuel efficiency and provide low rolling resistance have received SmartWay verification from the U.S. Environmental Protection Agency (EPA). The EPA established low rolling resistance requirements for retreaded truck tires in 2012, and verified tires must help reduce truck fuel consumption by at least 3%.

669 New worldwide patents received.

In 1900, when automotive tires were little more than oversized bicycle tires, Goodyear designed a better tire, thus creating the enduring Goodyear legacy of continuous improvement and innovation. Today, our success continues to be driven by innovation, and our associates around the world create innovative products, including those with low rolling resistance and other sustainable considerations.

COMMUNITY ENGAGEMENT

Goodyear has a long history of supporting its communities around the world. We strive to build and support collaborative programs that create positive outcomes for people, communities and the world around us. This mindset is reinforced through the company’s ongoing commitment to care for our communities.

2100 Students, parents and teachers in attendance at Goodyear’s 16th annual STEM Career Day.

In Akron, Ohio, Goodyear’s annual STEM Career Day engages local middle- and high-school students in challenging, hands-on STEM instruction and activities. More than 300 Goodyear associates volunteer their time to plan and supervise the event, which includes $40,000 in scholarships to deserving students.

Over $1 Million in funds raised for local charities by Goodyear Blimps since 2012.

Among other corporate responsibility programs, Goodyear supports the fundraising efforts of local charities by providing once-in-a-lifetime opportunities to ride the Goodyear Blimp at our Blimp locations in California, Florida and Ohio.

In 2015, for a fifth year, Goodyear hosted events for the general public at its three blimp bases to benefit the U.S. Marine Corps Reserve Toys for Tots Program. Attendees were invited to see the blimps up close while donating toys and cash to a worthy cause. More than 58,000 toys and $141 thousand have been donated since inception of the program in 2010. This includes a special donation in the form of a check for $10,000 from Goodyear made directly to the Marine Toys for Tots Foundation in 2015. Goodyear is recognized as a national sponsor and is a recipient of the Foundation’s Commander Award.”

With the above declarations of corporate responsibility, it should be noted that Goodyear has not always embodied the corporate values they’ve claimed in the annual report. Over the past 40 years, Goodyear has been associated with multiple hazardous waste lawsuits including the famous Love Canal site, which may explain why management’s most successful stretch goal was to eliminate waste disposal (“Company Spotlight: The Goodyear Tire & Rubber Company” 3). Goodyear also had been sued for worker safety concerns and consumer safety issues that have been blamed for thousands of automobile deaths. In 2003, Goodyear was forced to restate five years of its previous earnings that reduced declared earnings by over $100 million due to earnings management practices engaged in by management of European subsidiaries.

In addition, Goodyear was a party in three now famous precedent setting Supreme Court cases: one for equal pay, one for international judicial jurisdiction and another for improper evidence disclosure in a product liability suit. Dozens of other product liability and worker safety suits have been filed against the Goodyear Corporation over the past 10 years. However, for a company that employs 67,000 workers across the globe, the percentage of alleged wrongdoing appears to be minimal.

The most famous Goodyear lawsuit, which ruled in favor of the company, now has a law named after it as the legal structure was changed to protect workers in the future. The history of that law can be summed up in this summary of the original case ruling written by Linda Barkacs in the 2009 volume 12 of the Journal of Legal, Ethical and Regulatory issues titled “THE TIME IS RIGHT – OR IS IT? THE SUPREME COURT SPEAKS IN LEDBETTER V. GOODYEAR TIRE & RUBBER CO.”

“The plaintiff, Lilly Ledbetter (“Ledbetter”), began her career at Goodyear Tire and Rubber (“Goodyear”) in 1979. For most of her twenty year career at Goodyear, Ledbetter was the only female manager. Initially, Ledbetter’s salary was the same as that of the male managers. However, over time, Ledbetter’s salary slipped relative to that of the male managers. By 1997, Ledbetter was not only the sole woman manager, she was also the lowest paid manager. Ledbetter’s monthly salary at the time of her departure was approximately $3,700 per month. Similarly situated male managers at Goodyear made between $4,200 and $5,200 per month. In 1998, Ledbetter filed an administrative claim of discrimination with the Equal Employment Opportunity Commission (“EEOC”). She alleged that Goodyear violated Title VII of the Civil Rights Act of 1964 by paying her a lower salary because of her sex. Ledbetter’s claim eventually went to a jury who found in her favor. The District Court (in Alabama) entered judgment for Ledbetter for back pay, damages, attorney fees, and costs.”

Goodyear appealed the ruling based on the fact that the plaintiff had waited nearly 20 years to file a complaint for back pay, and the Supreme Court overturned the verdict in Goodyear’s favor. Legislation that prevents the recurrence of similar cases is now called the “Lilly Ledbetter Act.”

A second precedent setting Supreme Court case was Goodyear vs Brown, a case in which the tire company’s European subsidiaries won against the families of two boys from North Carolina who were killed in a tire blowout accident while in France on vacation. The Supreme Court ruled that the state of North Carolina could not bring suit against the French subsidiary of Goodyear due to lack of personal jurisdiction over a foreign company in a foreign country.

STAGES OF CORPORATE CITIZENSHIP

It would appear that Michelin and Bridgestone and Germany’s Continental have attained the innovative stage of corporate citizenship, with Goodyear, Sumito and Pirelli two stages behind at the Engaged level, followed by both Korean tire makers, Hankook and Kumho, and by the only other U.S. tire manufacturer Cooper, which lags far behind in the elementary stages of citizenship. However, despite comparatively low citizenship ratings, Goodyear is a world leader in waste management, having attained 100% landfill free sustainability, in which all of its waste products are recycled or consumed internally. Goodyear also ranks above its peers in water conservation and overall carbon emissions. Those waste management claims appear to be substantiated by credible news stories citing Goodyear’s zero landfill success (Criswell 1). With wide support of environmental critics on its landfill policy, it appears that greenwashing of environmental reporting is limited. In addition, the fact that the firm does not claim ties to the UN Global Compact and limits environmental credibility claims, it does not appear that Goodyear relies on bluewashing as a marketing tool.

CITIZENSHIP OVERVIEW OF SELECTED FIRMS

Bridgestone -BBB Rated – BRDCY

Starting with the world’s largest tire manufacturer, the Japanese owned Bridgestone Tire Company recently nudged its rival Michelin out of first place in global market share. However, in dollars of sales, Bridgestone has long dominated the world tire market in sales revenue and is considered by analysts to be environmentally focused in its policies (Bridgestone Corporate Website).

  • Utilizes Japanese reporting guidelines & Global Reporting Initiative (GRI Standards)
  • Environmental reports are verified for accuracy by the “Bureau Veritas”
  • Japanese company that bought up American tire maker Firestone
  • Auto industry leader in carbon reduction strategy and improvements
  • BB Rating from recent consumer safety recalls
  • Goal 35% carbon emissions reduction from 2005-2020
  • First to adopt non-petroleum based rubber ingredients


Michelin- MSCI A-rated

Reports Environmental Data in UNGC standards and GRI

  • 2nd largest tire mfg. French bought US tire makers – Uniroyal-Goodrich-Riken
  • Proprietary reporting program: MEF– Michelin Environmental footprint
  • Set target to reduce their “MEF” by 40% from 2010-2020
  • Environmental data required by regulators of industry
  • Sustainability is high corporate priority
  • EPA national performance track program participants (Michelin Corporate Website)

Goodyear-BB-rated

  • American company – World’s 3rd largest tire maker
  • Global EHS reporting standards (environmental-health-safety)
  • Focused on landfill and toxic waste reduction
  • Less focused on greenhouse gases
  • Slow to respond to initial green tech markets such as energy efficient tires
  • Carbon emissions per tire have dropped 21% in past 6 years (Goodyear Corporate Website).

Cooper Tire-BB-Rated

Cooper is second largest American tire company and the 10th largest in the world. Among the top 10, only Cooper and the two Korean tire companies Hankook and Komho refuse to publish environmental impact statements or discuss corporate citizenship goals in their annual reports. Because tire manufacturing is regulated by the EPA, Cooper does have some environmental data harvested from those compliance reports. There is no mention of carbon emissions on the Cooper investor website, however, Cooper is listed as very strong in energy efficiency policies on the MSCI data (Cooper Corporate Website).

As the metrics of corporate citizenship are compared, Cooper’s lack of investment in environmental technology becomes apparent as it trails the Big 3 by more than 10%, and Japanese Bridgestone leads the closest competitor by about 15%.


MSCI Carbon Footprint Ratings
Goodyear Bridgestone Michelin Cooper
5.1 6.9 5.6 4.6


MSCI Total Carbon Emissions
Goodyear Bridgestone Michelin Cooper
9 9.1 8.9 6.1


2015 MSCI ratings for total carbon emissions are very close among the Big 3, and the less environmentally concerned Cooper trails by nearly 30%.

MSCI Toxic Waste Ratings
Goodyear Bridgestone Michelin Cooper
5.6 5.7 7.8 4.4


In a surprising outcome for toxic waste ratings, despite Goodyear’s Zero Landfill Waste Campaign, Goodyear trails Michelin by a large margin, and Bridgestone by a smaller one. This may be attributed to PVC vapor escape rather than physical toxic waste dumping. As would be expected, Cooper tire trails the BIG 3 by about 20%.


MSCI Clean Technology Development Ratings
Goodyear Bridgestone Michelin Cooper
4.3 5.7 6.1 4.0


When it comes to a company’s investment in environmentally beneficial products, Michelin leads from its early introduction a decade ago in low rolling resistant tires, a market that Goodyear has recently began to dominate with a fuel saving heavy truck tire line-up. This does not, however, seem to be reflected in these ratings, as well as the potential upcoming release of Goodyear’s patented electricity generating tires, which could move them much higher in the clean technology ratings (“Goodyear Launches New Fuel Max LHS Tire” 1). Again, Cooper lags behind the Big 3 on this research and development category.


MSCI Water Stress Ratings
Goodyear Bridgestone Michelin Cooper
7.3 6.3 3.4 Unrated


In this metric, Goodyear leads with its water stress ratings. Goodyear plants are designed to capture rainwater for use, and also filter and reclaim used water for steam needs. To reduce potential environmental pollution, no Goodyear plant is supposed to have wastewater drains that lead off their self-contained property (2015 Goodyear Annual Report). Bridgestone joins Goodyear in high marks where normally high ranking Michelin lags, and Cooper refuses to report its water handling and usage policies.


MSCI Product Safety and Quality Ratings
Goodyear Bridgestone Michelin Cooper
3.3 3.3 1.2 3.6


With product safety to consumers, all of the Tire Industry falls below industry norms due to the competitive balance between product price competitiveness and the high level of liability that accompanies a tire failure. It seems that, historically, the ranking among the tire manufacturers varies with Michelin currently the target of dangerous tire failures to consumers.


MSCI Labor Management Ratings
Goodyear Bridgestone Michelin Cooper
3.9 2.2 5.0 4.6


Goodyear ranks third of the four companies in labor relation policies, with Japanese owned Bridgestone a distant last place. Several labor relations issues followed when they acquired U.S. based Firestone in 1988 as Japanese management policies have been at odds with U.S. union labor culture for decades. Many analysts believe that either poorly trained strike breaking workers or intentional poor workmanship by disgruntled workers was the root cause of one of the product liability’s largest recalls in history: the 2000-2002 Ford Explorer Firestone tire blowout crashes that resulted in costs of $3 billion dollars (“Strikes, Scabs and Tread Separations: Labor Strife and the Production of Defective Bridgestone/Firestone Tires” 255-258).


                                                          MSCI Health and Safety Ratings
Goodyear Bridgestone Michelin Cooper
8.7 7.6 5.3 Not Rated


In employee health and safety ratings, Goodyear leads its peers by a large margin. The costs of settling several large lawsuits over the past 20 years has motivated management to create strict workplace safety regulations. French owned Michelin came in a third place and American rival Cooper was unrated for health and safety.


MSCI Corporate Governance Ratings
Goodyear Bridgestone Michelin Cooper
5.1 6.3 7.9 6.8


Goodyear held a last place ranking on corporate governance rankings. Analysts’ commentary on the matter suggest that until recently Goodyear’s board of directors was comprised of an excess number of current and former insiders (“Consider Goodyear for the New Year” 1).


Anticompetitive Practices
Goodyear Bridgestone Michelin Cooper
4.2 4.2 5.0 Not Rated


Goodyear tied Bridgestone for second place in ratings for anticompetitive practices. In 1995, all four companies were investigated for alleged violations of U.S. antitrust laws. The 1995 justice department probe was the fourth for Goodyear, each investigation yielding insufficient evidence to bring charges. However, Cooper’s European subsidiary was convicted of violation of trust regulations in England, which was later reversed on appeal. The capital intensive barriers to entry of the tire industry for new competitors leaves the industry ripe for price cooperation among existing companies.


Business Ethics and Fraud
Goodyear Bridgestone Michelin Cooper
4.2 5.0 5.0 Not Rated


The MSCI ratings for management ethics and fraud are relatively consistent among the Big 3 with Cooper tire again unrated on this metric. However, Goodyear does rank last of the Big 3, with some of its score discounted, possibly due to the four antitrust investigations and  large civil settlement and precedent setting court case “Bahena vs. Goodyear,” where evidence showed that Goodyear managers deliberately withheld evidence in a product liability suit  (www/leagle.com/nco 201007 p235).


Concluding Remarks

Based strictly on MSCI corporate responsibility ratings, Goodyear would rank third of the four companies studied with its American rival Cooper in a distant 4th place, despite the fact that the overall MSCI score for both was a “BB”. A-rated Michelin leads “BBB” rated Bridgestone by a small and historically temporary margin. Over the past five years ratings, Michelin had averaged a single “B” rating behind Bridgestone’s average double “B”MSCI Rating. In financial performance, Goodyear appeared to rank last place of the four firms studied, with Cooper tire posting financials considerably higher than the Big 3, however Cooper’s short term profitability seems to be relative to their lack of leveraged growth and sustainability investments.

Despite Goodyear’s position in the rankings, analysts’ stock predictions for Goodyear’s future potential financials are more optimistic than any of the other companies. The support of stock analysts suggests that Goodyear is, at the core, a sound and responsible firm going through a temporary set of setbacks that began with the 2008 recession, and has been slower to recover than its foreign based peers. Overall, based on the unique industry hazards and Goodyear’s history of making corrections to its corporate direction following lapses of ethical behavior as can be evidenced by their superior handling of worker safety and waste dumping, we believe that Goodyear is an above average corporate citizen that recently has underperformed when compared to its peers in financial measures.


Works Cited

“Associate Volunteerism.” Goodyear Corporate. The Goodyear Tire and Rubber Company, 2016. https://corporate.goodyear.com/en-US/responsibility/community/community-support.html. Accessed 27 November 2016.

“Community Support.” Goodyear Corporate. The Goodyear Tire and Rubber Company, 2016. https://corporate.goodyear.com/en-US/responsibility/community/community-support.html. Accessed 27 November 2016.

“Company Spotlight: The Goodyear Tire & Rubber Company.” Marketwatch: Automotive 7.3 (2008): 15-22. Business Source Alumni Edition. Web. 23 Nov. 2016

“Consider Goodyear For The New Year.” Dow Theory Forecasts 72.1 (2016): 8. Business Source Alumni Edition. Web. 23 Nov. 2016.

Criswell, Kristen. “Breaking through: Goodyear Tire & Rubber Co.” Tire Review 2016: 16. Business Insights: Essentials. Web. 23 Nov. 2016.

“Goodyear in Global Shake-Up In Pursuit Of ‘Added-Value’.” European Rubber Journal (2016): 0009. Business Source Premier. Web. 23 Nov. 2016.

“Goodyear Launches New Fuel Max LHS Tire.” Bulk Transporter 77.11 (2015): 47. Business Source Alumni Edition. Web. 23 Nov. 2016.

“Goodyear Pumped With Tire Profits.” Dow Theory Forecasts 71.27 (2015): 8. Business Source Alumni Edition. Web. 23 Nov. 2016.

“Goodyear Fined For Conveyor Death.” Industrial Distribution 88.5 (1999): M4. Supplemental Index. Web. 23 Nov. 2016.

“Goodyear picks PPG silica for SUV tire.” European Rubber Journal 2015: General OneFile. Web. 23 Nov. 2016

McNulty, Mike. “Goodyear Fined $1M+ For Danville Deaths.” Tire Business 34.15 (2016): 0003. Business Source Premier. Web. 23 Nov. 2016.

“Natural rubber demand risks Asia’s ‘biodiversity’.” Tire Business 2015: Business Insights: Essentials. Web. 23 Nov. 2016

Pan Kwan Yuk “Goodyear takes $646m hit on Venezuela” Financial Times. Feb 9. 2016.

Pierce, Alan. “The Goodyear BHO3–A Car Tire That Generates Electricity.” Tech Directions 75.4 (2015): 8. Business Source Alumni Edition. Web. 23 Nov. 2016.

“Safe.” Goodyear Corporate. The Goodyear Tire and Rubber Company, 2016. https://corporate.goodyear.com/en-US/responsibility/community/community-support.html. Accessed 27 November 2016.

“Smart.” Goodyear Corporate. The Goodyear Tire and Rubber Company, 2016. https://corporate.goodyear.com/en-US/responsibility/community/community-support.html. Accessed 27 November 2016.

“Sustainable.” Goodyear Corporate. The Goodyear Tire and Rubber Company, 2016. https://corporate.goodyear.com/en-US/responsibility/community/community-support.html. Accessed 27 November 2016.

“Sweet Spot.” Tire Business 34.5 (2016): 0013. Business Source Premier. Web. 23 Nov. 2016.

“Tech News: Goodyear unveils electric car tires.” Electronics For You 2015: General OneFile. Web. 23 Nov. 2016.

“The Goodyear Tire & Rubber Company SWOT Analysis.” Goodyear Tire & Rubber Company SWOT Analysis (2015): 1-9. Business Source Alumni Edition. Web. 23 Nov.

General Motors: Social Stigmas Faced By Industrial Workers

Todd Benschneider

September 16, 2012

General Motors Recovery and the Influence of Social Stigmas Faced By Industrial Workers

           The 2008 bailout of General Motors remains a focal point of economics analysts and political journalists. Today, nearly four years after its corporate collapse, reporters alternate between glowing praise and sharp criticism. However, regardless of journalistic viewpoint, one fact cannot be ignored: General Motors has clawed its way back up Fortune Magazine 2012 rankings into 5th place of America’s largest revenue corporations (Morgenson 1).

The second observation that can not be ignored is that the press and public opinion during the recovery period have focused heavily on corporate leadership and the politicians who engineered the bailout.  A crucial factor missing from the news articles: The devotion shown by designers and assemblers at General Motors who have banded together to prove that they can produce a world class product at a competitive price. The thousands of headlines during the period the followed the auto industry meltdown reflect the values with which modern Americans view industrial workers, providing recognition to white collar workers and leaving unmentioned of the achievements from the engineering and the industrial trades, this shift in values may be contributing to declines in domestic production.

Much of this anti-union and industry sentiment results from taxpayer resentment of the government rescue of the world’s largest automaker General Motors, that left the American taxpayers owning 31.9% of the common stock. Today GM rightfully wages a daily war on two fronts: normal industry competition and now the new front of public relations, under a microscope of press scrutiny and public opinion. While this scrutiny seems to have generated results with increased accountability,  as units sales climb, product ratings improve and as profitability reaches new levels. This can be seen in the 2012 employee profit sharing plans, which will provide dividends to compensate for a large portion of the pay cuts hourly employees had accepted as part of the restructuring plan. According to an article in the New York Times that for 2012 it is projected that “45,000 union workers would receive profit-sharing checks averaging $4,300, the most in the company’s history” (Morgenson 4).

However, many industry critics present pessimistic statistics possibly influenced by political agendas and an ingrained anti-industrial sentiment. In an example, an article that opens with anti-Obama critique, industry writer Louis Woodhill wrote a scathing review of GM products in the August edition of Forbes under the shocking title “General Motors is Headed for Bankruptcy—Again”. In the article Woodhill interprets a scoring aspect of recent “Car and Driver” review with:

“Not only was the 2013 Malibu (183 points) crushed by the winning 2012 Volkswagen Passat (211 points), it was soundly beaten by the 2012 Honda Accord (198 points), a 5-model-year-old design due for replacement this fall. Worst of all, the 2013 Malibu scored (and placed) lower than the 2008 Malibu would have in the same test.”

Despite a moderate share of negative press many Americans, influenced by recession and unemployment are reconsidering purchasing American industrial products in hopes that their support will result in a mutually beneficial environment for the American economy. This attitude is shared in the New York Times news article titled “General Motors 2012 Earnings: Second Quarter”, which while presenting a negative spin on GM’s European subsidiary, the article does present a positive spin on GM’s domestic operations with the paragraph:

“In its new carnation, the automaker is proving that it can be profitable at a lower sales volume. The company announced in February 2011 that it earned 4.7 billion in 2012, the most in more than a decade. It was the first profitable year since 2004 for G.M. which became publicly traded in November 2012, ending a streak of losses totaling about $90 billion” (Morgenson 1).

However recently an equal number of industry writers have taken a middle of the road stance on the American auto industry such as the CNN Money article entitled “A Recovering GM is Losing Ground at Home” which despite opening with the statistic that GM lost nearly 2% of the domestic market share in 2012, the article goes on to cite the influence of external factors by quoting auto industry economist Sean McAlinden with “Its very complex, the latest downturn isn’t from lack of sales, it is the result of GM closing down 3 million units of production facilities to improve profitability.” The article also offers hope in the second paragraph with “The Cadillac division in coming months will benefit from two key new model introductions” (Levin 1).

Economists and political journalists write about GM leadership strategies and shareholder returns but ignores those autoworkers putting in the effort day after day to prove that they can once again dominate the global automobile market.  This critical public opinion of American manufacturers and the negative stigma of industrial trades is withoutquestion the greatest obstacle of corporate moral. The resulting negative self-image among industrial workers slows the progress of American industry and that anti-industrial sentiment begins with the attitudes that modern Americans view those industrial jobs.

Over the past 150 years careers in manufacturing goods that were once viewed as hi-tech careers are perceived by many with a negative stigma. This negative connotation is fostered through the American educational system, especially seen in views of the parents of school children in manufacturing communities. The attitudes being imbedded in schoolchildren are that by studying hard and earning professional credentials that they could escape a dirty and dangerous, low paying life of industrial work. Those children later grow into consumers that believe that through hard work and achievement that they “escaped industrial servitude” with careers in medicine, science and especially education and who grow  up to resent industrial workers earning similar wages who in their eyes have not earned the right to those wages through scholastic self-improvement. What many educated professionals do not realize is that those high paying industrial jobs need to offer compensation levels that can attract reliable workers to fill jobs with much less desirable working conditions.

These anti-industrial trade values are crippling todays American manufacturing companies, especially in the automobile industry. A slow drive throught the parking lot of any white collar company such as JP Morgan here in Tampa and you can count that nearly 85% of white collar workers in non-industrial cities buy foreign produced automobiles and the  15% of the exceptions to that rule are almost exculsively those few who desired the largest of SUV’s that do not have foreign counterparts. Polling these owners for an explanation, uncovers the nearly universal response offered by import owners, is their belief that the American manufacturers produce an inferior, unreliable product. Many that offer this assumption often admit that they had never owned a new American car for comparison, and deveolped these opinions from information from the press.

The declines in American manufacturing will likely continue until society offers industrial achievement similar recognition to those contributing to the advancements in computer technology and finance professions. You can not build a championship team without being able to recruit the best engineering talents entering the workforce and you can not obtain those cream of the crop graduates to accept a job in an industry with a sinking prestige factor.

Work Cited

Levin, Doron. “A Recovering GM is Losing Ground at Home”. CNN Money. May 11, 2012

http://features.blogs.fortune.cnn.com/2012/05/11/gm-2/

Ed. Morgenson, Gretchen. “General Motors 2012 Earnings: Second Quarter”. The New York  

Times. August 2, 2012

http://topics.nytimes.com/business/companies/general_motors_corporation/index

Woodhill, Louis. “General Motors is Headed for Bankruptcy –Again” . Forbes. August 15, 2012

http://forbes.com/sites/louiswoodhill/2012/08/15/general-motors

Board Independence is Less Effective at Deterring Accounting Fraud in Family Controlled than in Publicly Held Corporations

An Annotated Bibliography by Todd Benschneider

Prencipe, Annalisa. Bar-Yosef, Sasson. “Corporate Governance and Earnings Management in

Family-Controlled Companies.” Journal of Accounting, Auditing and Finance. April 2011,

Vol. 26 Issue 2, p199-227. 29p. Database: Business Source Alumni Edition.

Annalisa Prencipe, PhD. and senior lecturer at SDA Bocconi School of Management with her team of researchers conducted a study of 249 firms to compare the quality (long-term sustainability) of profits in family controlled firms to earnings of publicly held companies. The study investigated the impact of “earnings management strategies” a term that The Journal of Accountancy defines as “the discretionary distortion of revenue, expense and depreciation schedules to optimize short term goals such as executive bonuses, budget targets or manipulation of stock prices.”  The results of the study were intended to provide accounting firms with new tools for identifying ratios and patterns that detect shareholder fraud in family controlled firms.

In publicly held firms strong incentives such as performance bonuses, performance reviews and salary bonuses lure executives to portray company financials in the most positive light, while concealing negative information from financial reports. However, over reporting earnings provides inaccurate feedback to the product development, finance and marketing departments who rely on accurate reporting to steer future products and operations strategy. Extended periods of inaccurate market feedback can undermine the long term economic health of the company. Stockholders can reduce mismanagement by electing an independent board of directors who hire, evaluate, supervise and fire top level executives to ensure that strategic decisions represent the shareholders’ best interest.

Prencipe explains that “A typical board structure is composed of outside directors and top company officers. Outside directors are appointed by the company’s shareholders and are assumed to be acting in the shareholders’ interests. However, the inclusion of top management among board members may give rise to a conflict of interest as management may attempt to transfer wealth from stockholders by taking advantage of information asymmetry. The results show that the increase in shareholder wealth is significantly higher when the board is dominated by independent directors.”

Recent trends in corporate governance now encourage firms’ directors to enforce accurate financial reporting. Board oversight can identify executives who exploit short range strategies that inflate profits to capitalize on performance bonuses. By the time the earnings management schemes unravel, the executives involved have often retired or moved on to other companies, which limits the legal recourse available to the stakeholders. Public demand in response to recently publicized investor fraud cases have prompted legislators to issue regulations that hold board members accountable to shareholders for fraudulent reporting of the executives they oversee. Regulatory changes in corporate governance have been eliminating the participation of company executives from the board of directors to reduce their influence over the boards’ objectivity, especially by eliminating CEO’s from also serving as the Chairman of the Board.

However, family controlled companies face different incentives to publish inaccurate financials, and further compounding the distribution of power, the CEO is often times also the largest stockholder of the company, entitling them to serve as the Chairman of the Board.  Prencipe wrote “Current literature suggests that, although founding family ownership seems to be associated, on average, with higher earnings quality, the extent of earnings management remains an open issue for family controlled firms. Since most families with controlling interest in their company possess a long term vision for growth and therefore make decisions that favor long range goals rather than boosting quarterly profits.”

Prencipe believes that while experts agree that there is less incentive for family controlled firms to over report earnings, that instead those companies manage earnings to secure the family’s controlling interests, minimizing the distribution of wealth to minority shareholders. She hypothesized that recent corporate governance restructuring would be less effective in family controlled companies whose self-interest lies in underreporting earnings, especially present in where the family also served in salaried executive positions by increasing family members bonuses or siphoning private benefits at the expense of other shareholders such as supplier kickbacks, travel expenses and other concealable business write offs.

The study was expected to validate previous research that had shown a lower incidence of earnings management under a board of directors with independent decision making authority, especially those boards lacking a CEO chair holder.  A board possessing low levels of independence has many of the company executives voting on board decisions, with the CEO also serving as the chairman of the board. In cases of a highly independent board the CEO does not hold a seat and possesses only subordinate levels of authority in regulating corporate accounting. However this study would specifically compare results from widely held public corporations against those from private firms and measure the estimated earnings management strategies present in the financial reports. Levels of earnings management in the companies would be calculated from a fraudulent accounting indicator: abnormal working capital accruals (AWCA).

Prencipe and Bar-Yosef conducted a study of Italian corporations by applying AWAC audit calculations to a sample of 249 Italian corporations consisting of four publicly traded corporate governance structures:

1-      Family Controlled with CEO on the Board of Directors

2-      Family Controlled with no executives on the Board of Directors

3-      Publicly Held with CEO on the Board of Directors

4-      Publicly Held with no executives on the Board of Directors

The intent of their study was to see if a correlation could be found that suggested that any of these four governance structures yielded a higher quality long range financial growth. The results validated several previous studies that found higher quality earnings generated by publicly held corporations with a highly independent board of directors. The results also supported Prencipe’s hypothesis that family controlled firms outperformed publicly held firms in earnings quality; however there was a less pronounced advantage to private firms with a highly independent board when compared to public firms with an identical governance structure.

Prencipe’s closed her article with:

“Our conclusions may lead regulators and academics to reevaluate the effectiveness of some corporate governance models when applied to family controlled companies. In particular, our results suggest that regulators should pay special attention to the selection of board members. For the benefit of all shareholders, it is important to guarantee substantial independence of the board. Our results are also useful to users of financial statements, suggesting that a company’s ownership structure and its corporate governance characteristics should be taken into account when accounting numbers are used.”

Enron Collapse: A Case Study in Audit Failure

August 29th, 2015

News broke in October of 2001 that energy conglomerate Enron was declared insolvent; the story that followed revealed the largest case of accounting fraud in history. As a result, Enron declared bankruptcy and one of the nation’s largest accounting firms Arthur Anderson was forced out of business. Analysts were shocked to discover how long Enron had been able to manipulate its reported earnings without discovery by auditors or the board of directors (Catanach. 2012).

Today it is still uncertain whether auditors from Arthur Anderson’s Houston office were compensated to overlook the numerous accounting discrepancies or instead, simply unqualified to decipher the unique accounting procedures developed by the Enron management. The catastrophic loss to shareholders and employees pensions serves as a warning to auditors of the devastation that inadequate accounting procedures can cause (Mclean. 2001).

As a result of the intentional manipulation of reported profits, sixteen Enron executives were convicted of defrauding investors. The primary defendant, company founder and financial advisor to President Busch: Kenneth Lay was sentenced to 45 years for his crimes, but died of heart failure before serving his sentence. CFO Andrew Faustow cooperated with SEC investigators and was sentenced to 10 years without parole for insider trading, tax evasion and defrauding investors. CEO Jeffrey Skilling was sentenced to 24 years. Accounting firm Arthur Edwards and several key employees were convicted of obstructing justice by shredding thousands of pounds of documents and deleting thousands of emails as the scandal made the news. The Arthur Anderson employee convictions were later overturned by US Supreme Court (Mclean. 2001).

The combined losses of over $150 billion dollars to shareholders, creditors and employee pension funds negatively impacted the US economy in a sum equal to that of every American man, woman and child losing $533 for 2002. Public outcry over corporate irresponsibility resulted in the drafting of the Sarbanes-Oxley Act of 2002 which was created to address every loophole that Enron used to elude detection. Today SOA regulations dictate many of the federal accounting reporting standards and policies. Despite SOA guidelines, many privately held companies and several major publicly held companies continue to fail after earnings management schemes unravel (Jain. 2013).

The catalyst to Enron’s aggresive cycle of earnings management tactics was ignited by the deregulation of the electric power industry in the years prior to the scandal. With newfound freedom from government oversight, Enron management was able to sell hedge contracts on energy futures and report hedge values as actual sales; this practice greatly overstated annual revenue and gave the illusion of record breaking growth and profits. Enron management gradually created a highly competitive corporate culture that rewarded high performing employees for generating short term solutions that would make the company look good in quarterly reports and continue to attract investors and drive stock prices. Many employees even at lower and middle management received large percentages of their salary as stock options for hitting bonus levels or at least creating the illusion of achieving performance goals (Watkins. 2002).

The sheer complexity of accounting the true values of energy futures hedging using market to market costing and uncovering the management earnings schemes that were created by the 20,000 employee army who were all being encouraged to boost their bonuses by finding creative ways to manipulate Enron’s stock prices (Helman. 2013). The corporate culture snowballed out of controlled as management began to actively recruiting new hires who showed promise of financial creativity and also held flexible attitudes towards ethics, with this strategy the managers of Enron were able to create an ingenious army of professional corporate swindlers, and provided them a rich environment to capitalize on those talents. These and other factors created an accounting system so elaborate and deceptive that investigators had difficulty uncovering the flow of cash even after the scandal unraveled (Watkins. 2003).

Enron for several of their final years poached the best and the brightest performers from competing firms by offering salaries at twice the market rate being offered by competitors. Recruiting top talent combined with a policy of automatically culling the lowest 15% performers from the workforce every year generated a culture where every employee carefully avoided  bearing bad news and their mistakes or losses were swept under the rug to protect jobs (Watkins. 2003).

Not only were the salaries aggressive but perks and extravagant expense accounts made available jobs at Enron highly sought after. This ultra-competitive culture pushed all employees to find creative and innovative ways to inflate their own contributions to the company’s bottom line, at least for short term gains with little regard for long term repercussions (Jain. 2013).

A recurring theme to Enron’s development was the massive expansion into industries and locations that Enron was poorly equipped to compete in. The corporate background in supplying natural gas to the western US could not have prepared them for the projects they would undertake such as building a $900 million power plant in India that failed to ever produce revenue after disagreements with the government of India. Another failed “get rich quick scheme” was the Wessex Water Co in England which Enron paid $3 billion for and then offered its shares to the public in an IPO which lost nearly $100 million per month until its collapse in August 2000 (Watkins. 2003).

Possibly the nail in the Enron coffin was their overconfidence in their ability to provide the distribution of utilities to the public. In 20000 Enron invested billions in fiber optic technology to provide cable television and internet to over half the households in the US. The fiber optic division managed to lose over $10 million per month (Catanach. 2012)

Enron initially built a track record of performance while under the guidance of CEO from 1990-1996 Rich Kinder, a business attorney, who in comparison was credited for his conservative management style. Under Kinder’s leadership Enron earned much of the credibility that would later be used to attract investment capital and industry credibility. The talents of Kinder are later substantiated as the driving talent, as he later went on to build multibillion dollar energy conglomerate Kinder-Morgan (Mclean. 2001).

The rise and fall of Enron ends with the losses in billions of dollars to defrauded investors. These losses resulted from a decade of greed driven earnings management schemes that enabled Enron employees to participate in a Ponzi like deception of stockholder funds. A corporate culture is created from the top down and exaggerated by recruiting and hiring policies. One of the defining points of Enron’s downward spiral was hiring the most intelligent candidates who also exhibited a moral flexibility toward earnings management policies and held a Robin Hood disdain for constrictive industry regulations. While it is important that we hone our auditing policies to detect earnings management schemes such as those at Enron, we cannot overlook that a recurring theme is the human resources failure to screen out candidates who would overlook long term sustainability for personal gain for their share in the corporate greed (Watkins. 2003).

Work Cited

Catanach Jr., Anthony H., and J. Edward Ketz. “ENRON Ten Years Later: Lessons To       Remember. (Cover Story).” CPA Journal 82.5 (2012): 16-23. Business Source Premier.

Helman, Christopher. “10 Reasons Why Houston No Longer Cares About Enron Or Whether          Jeff Skilling Gets Out Of Jail Early.” Forbes.Com (2013): 1. Business Source Premier.          Web. 10 Jan. 2014 Web. 10 Jan. 2014.

Jain, Pravin. “Confessions Of An Enron Executive: We Lacked Finesse.” Emergence:           Complexity & Organization 15.2 (2013): 104-109. Business Source Premier. Web. 10 Jan.           2014.

Mclean, Bethany, et al. “Why Enron Went Bust. (Cover Story).” Fortune 144.13 (2001): 58-68.           Business Source Premier. Web. 10 Jan. 2014

Watkins, Thayer. “The Rise and Fall of Enron” 2003.            Web. http://www.sjsu.edu/faculty/watkins/enron.htm

Che Guevara – Revolutionary Idealist or Fanatic

The life and times of 1960’s cultural icon Che Guevara remain a topic of heated debate, with a growing legion of modern American supporters who idolize him as a Robin Hood Revolutionary contrasted against opponents who despise him as ruthless, aspiring dictator. Extremes of each belief are heavily influenced by which period of Che’s life falls under critical scrutiny, his behavior in his early twenties could support an argument for sainthood, in his later years the evidence could support the accusations of madness.

Guevara first gained political notoriety as the right hand of Fidel Castro during the Cuban Revolution, however his career later ended while plotting a foiled coup de taut against the Bolivian government. In modern American culture in recent years his legend was reignited with recent award winning films about the journals he wrote during humanitarian mission in South America researching leprosy while studying medicine. Today his admirers envision him as a selfless revolutionary, liberating the common people from corporate exploitation, poverty and oppression.

Che’s critics suggest that he was a narcissist, power-hungry dictator, driven by his own vanity and addiction to adventure and chaos. Some critics claim that his underlying motives were only to exploit popular anti-government sentiment to build a power base in his climb toward dictatorship with empty promises for wealth to the poor as his justification for terrorist tactics.

One thing that both sides seem to agree on was that Che was focused on eliminating United States political presence in the Spanish speaking regions of the Americas, which easily made him a hero to many South Americans. The actions of his 40 year life were influential enough to land Guevara on Time Magazines “100 most influential people of the 20th Century”.

His beginnings, biographers on both sides unanimously agree that Che was born Ernesto “Che” Guevara to a prominent and politically active Argentinian family. Influenced by his father’s friends comprised of intellectuals, politicians and powerful businessmen, he showed an interest in political leadership at an early age. As a boy Ernesto overcame asthma to excel in athletics and academics. He was remembered as an aspiring medical student, fascinated with the psychological principals of Sigmund Freud and the political philosophies of Nietzsche and Machiavelli. His own father made many references to Che’s persistent lifetime conflict with authority figures and was quoted with “Ernesto was born with the blood of Irish Rebels coursing through his veins”. On several occasions Che was reprimanded by the Catholic elementary school he attended for condescending remarks he had made about the church (Guevara Che Prologue). 

Guevara is most widely known in modern American culture for the diaries he kept during a 5000 mile 1951 road trip across South America to volunteer at a village of lepers in Peru which became the inspiration for a best-selling book titled “The Motorcycle Diaries”, later made into a popular film in 2004 by the same name. His area of study in medical school was on the disease of leprosy (Guevara Motorcycle 146-149). His emotionally charged speeches on poverty and the corporate exploitations of peasant workers are considered by many intellectual critics to be the wisdom of an insightful philosopher. During his now famous trip across South America he was caught up in the revolution to liberate corporate owned land in Guatemala and redistribute that land to the peasants who farmed it. The Guatemalan revolution was quickly put down by U.S. troops, which forced Guevara to leave the country (Guevara Che 24).

Near Mexico City, after his escape from Guatemala, Che was introduced to a like-minded revolutionary named Fidel Castro, who was dedicated to overthrowing the corrupt Basque leadership in Cuba. At this time, several biographers noted that Guevara seemed to grasp the importance of propaganda in their revolutionary tactics as he began to publish a newspaper that criticized the opposition to the movement and later a started radio station he called “The Voice of Free Cuba” (135). During this period he first became feared as a leader who killed any members of the revolution that deserted the cause to return home or serve as informants for the opposing government. Several military analysts credit Guevara with brilliant combat and counterintelligence tactics. His surprising successes earned the respect of his opponents of the US military, conceding that he possessed an apparently brilliant military intuition and found that Che’s unique guerilla tactics very surprisingly effective  (Guevara Che 8).

The period that Guevara served with Fidel Castro building a newly communist Cuba is the period of his life that is most publicized by his critics. During his tenure in Cuban government Guevara managed to redistribute land and factories owned by capitalists to the working class of the Cuban population, however he also made it his personal goal to educate the peasant population and managed to quickly raise the rural literacy rates from 70% to 96%. The sincerity of his humanitarian gestures is uncertain, but these policies did prove effective at loaning Guevara positive image to offset the ordered executions of political prisoners that soon followed (Guevara Che 93-95).

Che’s military successes as well as administrative effectiveness led to his promotion to Cuban Finance Minister.  Revered for working for days without rest, never stopping to eat or sleep, earned the respect of his followers. However his ineffectiveness as finance minister became his political undoing and is seen as the first failure of his career, undermining public support of the Cuban Revolution. Guevara’s assumption that citizens would be more productive under communism proved to be much less effective than he expected. His perceived failure governing the economy and later his own disillusion following Soviet concessions during the Cuban Missile Crisis may have been the catalyst driving Che to leave Cuba to serve as an anti-capitalist spokesman around the world. He disappeared quietly from Cuba to join a band of revolutionaries in the Congo of Africa (Guevara Che 167-176).

In Africa Guevara joined an army of Cuban-African guerilla fighters who were attempting to overthrow the government of the time. Detractors believed that Che envisioned himself becoming the Castro of the Congo if their coup was successful. However, Guevara underestimated how much the Swahili language barrier would limit his ability to lead and inspire the people. Ultimately his leadership of the Africans is universally seen as a humiliating failure that began to cast doubt even among his supporters Che’s political wisdom (Fontova 167-174).

A year and half after aborting the African campaign, Guevara disappeared into the Bolivian jungle to train an army of guerilla fighters for an attempt to overthrow the Bolivian government. Che’s critics believe his motives were to gain power needed to become the new dictator of Bolivia if the overthrow was successful. It was a fear of his future power that motivated the CIA to locate him and secretly undermine his effectiveness in Bolivia. It is believed that in his 11 month stay Bolivia that United States CIA were using traitors close to Che to sabotage his radio equipment, intercept his supplies and spread anti-Guevara propaganda to potential local supporters, all of which ultimately left the Che’s guerilla army isolated, starving and in need of medical supplies. Political theorists attribute Che’s harsh and condescending attitude to other guerilla leaders undermined his ability to gain the financial and political support needed to grow his revolutionary movement (Guevara Che 147).

Guevara’s condescending attitude toward other party leaders remains a recurring theme in his diaries, the December 31st  1966 diary entry describes a clash of egos on his first meeting with Mario Monje, head of the Bolivian communist party who was about to extend the political support of the party to Che’s revolution. Monje’s only request in the discussions was to be considered to be the leader of the revolution movement that took part on Bolivian land, however Che insisted that he was the self-appointed leader of all procommunist revolutionary activity in South America. The incident even in Guevara’s own self-delusional spin reveals his Achilles heel as a complete lack of interpersonal tact with other party leaders and hints that his true aspirations were to become the totalitarian ruler for all of South America, if indeed his revolution proved to be a success (Guevara Che 125-140).

In a story that sounds remarkably similar to the recent capture and execution of Osama Bin Laden, a group of 1800 soldiers led by US Special Forces surrounded Che’s camp and overtook it in a quick battle. Che was taken wounded, interrogated, then by order of Bolivian president, executed immediately before news of his capture could incite supporters. After he was shot he was put on public display for proof of his death and his hands were amputated and sent to Buenos Aires where fingerprints on file could confirm that it was indeed Che Guevara’s body. Much in line with the stories of Osama Bin Laden’s burial at sea, Guevara’s remains were disposed in an undisclosed location by Bolivian soldiers. Years later a Bolivian General, divulged that the body had been buried in a mass grave near an airstrip. Archeologists located the grave and confirmed remains to be Guevara and transported to Cuba for formal burial (Fontova 209).

Today Che Guevara’s legend seems to have more followers that idolize him than those who demonize his life. In 2008 the Bolivian government released several of Che’s diaries taken during his capture, these recent publications have sparked a renewed interest in the life and times of Che Guevara, the context of his final writings has caused a swing of public opinion that many view him now to be a Robin Hood martyr at best to be worthy of sainthood rather than the murderous egomaniacal dictator that his detractors believe. Regardless of his motives, it seems evident that his actions were all ultimately leading to his self-appointment to position of dictator in any country he could gain control of in effort to apply his visions of a communal utopia.

From the reading and research I completed for this paper, I conclude that the anti-Guevara theorist Fontova’s book is so heavily contaminated with emotional bias and blatant anti-Castro propaganda on the life of Che that it is difficult to take his accusations against Guevara seriously. The book draws some hard character conclusions that would seem unlikely for Fontova  to support with real evidence.  Fontova makes little attempt to cite academically credible sources in his expose on Guevara; however I do assume that there must be some first-hand historical sources and personal interviews that lend might him some credibility on the subject to gain the support of the publisher.

The extremity of radical accusations made by Fontova prompted me to research the credibility of Fontova as a political analyst, from what I could gather, outside of a degree in political science, Fontova has spent most of his career writing for hunting and fishing magazines, later writing two fictional adventure books. Fontova’s own self-promotional website even further undermines my ability to consider his point of view as a self-declared expert. I did not find much evidence that Fontova was a qualified expert on US foreign affairs and his short childhood in Cuba does not qualify in my opinion qualify  as enough first-hand experience to be the expert on Cuban politics that he claims to be.

In my opinion Fontova’s book can be criticized under the same principles that he charges Guevara with,  Fontova’s book seems intended to incite hatred against supporters of socialized ideals or those who oppose democratic expansionism, just as Che sought to create fear and hatred in opposition of capitalism. Today’s society recognizes the dangers of radical idealists and fear targeted propaganda. In hopes of preventing future wars, individuals must examine emotionally charged propaganda like Fontova’s book “Exposing the Real Che Guevara and the Useful Idiot’s Who Idealize Him” with a critical eye and question the simple logic that millions of people supported the ideals that Che proposed were as purely evil as Fontova would like us to believe.

For the Guevara supporters, they have the luxury of Che’s first hand opinions, in his own handwriting, on those historical events. What I detect in those diaries were not the personal private thoughts of Guevara as much as his own propaganda tools, I suspect that no man in a position of power writes his beliefs down in a notebook and expect them to never be read by prying eyes. Over his lifetime, his diaries were often left behind at deserted guerilla campsites and  found by opposing troops, because of this pattern I believe that the contents of those diaries were his weapons in the propaganda war.

However much that Guevara tried to spin the events to paint himself in a favorable light, it is not a far stretch to assume by reading between the lines of Guevara’s two diaries that he was driven by a manic fueled sense of self-delusion that evolved from compassionate ideals  into sociopathic behaviors. I can see that it is his eloquent writing and his ability to spin events with a flattering self-delusion to portray himself as a heroic martyr that masks his underlying obsession with thrill seeking adventure and a quest to obtain legendary power and fame.

I believe that ultimately Che Guevara suffered from the grandiose delusions, often observed in cult leaders, referred to as “The Messiah Syndrome”, self-appointed leaders who believe that they were put on earth by a higher power to change the future of the world. In layman’s terms we typically label those cult leaders as “Madmen”. A clue to this personality disorder is a very revealing tale that childhood classmates at Guevara’s elementary school shared during  interviews for biography on the Discovery Channel, they recited a  story about an outburst Che had in a discussion about the sainthood of Jesus Christ, where Che exploded and insisted that Jesus was (in loose translation) “Overrated” and that Che planned to make Jesus’ accomplishments pale in comparison. Many years later, during a public address he is cited with one of the most damning quotes of his career when he declared: “In fact, if Christ himself stood in my way, I, like Nietzsche, would not hesitate to squish him like a worm”. To further support conclusions of madness, in Che’s Bolivian Diary he confesses to stabbing his horse in the neck for walking too slowly, two journal entries later, Che makes a reference to the horse stabbing and questions his own sanity. There is certainly an opportunity to publish a very critical view on Guevara’s life today, however Fontova’s radicalism on the topic has done very little to advance the cause of Guevara critics.

Work Cited

Fontova, Humberto. Exposing the Real Che Guevara: And the Useful Idiots Who Idolize Him.

New York: Penguin Books, 2007. Print.

Guevara, Ernesto. Che: The Diaries of Ernesto Che Guevara. Melbourne, AU:

Ocean Press, 2008. Print.

Guevara, Ernesto. The Motorcycle Diaries: A Journey Around South America.

                 London: 1996. Print.

Consumer Resistance to Superior Technology: General Motors Hybrids, Siri and Video Messaging, Why are We So Slow to Adopt?

Todd Benschneider

University of South Florida
Revised 4/23/2018

When I first wrote the foundation for this article on “Consumer Resistance to General Motors Hybrid Vehicles” nearly six years ago, I was hoping to make sense of the unexpected marketing challenges that we uncovered when Americans proved surprisingly reluctant to purchase the General Motors electric and hybrid option vehicles in 2012.

The market timing of 2009-2012 seemed ideal for electric automobile technology, with record high fuel prices, deeper understandings of global warming and the inevitable decline of petroleum production in the coming century.

On the surface, it seemed to be a reasonable assumption in 2012, that industry projections for alternate fuel vehicles would become a reality and “most cars of  the future” (by 2020 was the expectation) would employ some form of electric or hybrid powertrain.

It is ironic how eight years into the future seemed limitless in its potential; but, eight years ago, feels like it was just yesterday.

How could anyone not want inexpensive clean energy cars; especially, ones that cost less than a dinosaur powered vehicle?

Few people would even argue that oil reserves could possibly sustain our current demand for gasoline for future generations.

The proposed electric car technology was reliable, those powertrains had proven their reliability for a decade of testing.

The price was certainly right, General Motors hybrid options for Buick Lacrosse and Chevrolet Malibu were priced the same as the gas versions and, as bonus, the hybrids were even more powerful and provided income tax credits.

How could that not sell like a syrup covered hot cake????

I still shake my head in amazement at how difficult it was to get rid of the hybrids we ordered in 2011 at our Buick-GMC store. Several sales managers would have probably been fired if our veteran inventory manager Sandy had not pushed back and insisted that we limit our initial order to six units rather than the twenty that I thought was a very modest forecast …. this was not her first rodeo.

Sandy probably saved my job and managed to dealer trade most of those six aged units from our inventory and I for one, learned a valuable lesson in product development: think twice before building a superior solution for customers who do not see a problem worth solving.

Since that realization I, like many in the industry, have concluded that unless government intervention mandates the phase out of petroleum powertrains, the adoption rate of electric-powered vehicles could take another two decades. Looking ahead now from 2018, I have adjusted my expectations down a few notches from back in 2012; now, I suspect that relying on the market demand alone to bring electric powertrains to full-scale adoption would be overly optimistic.

I find myself taunting the overzealous Tesla enthusiasts with history trivia that the automaker Detroit Electric nearly overtook gas automobiles in the early 1900s, selling over 13,000 electric cars that had top speed of 20 mph and a recharge range of 80 miles. A current Tesla 3 base model is rated for 220 miles of recharge range and with modern production capability has only recently surpassed 200,000 units sold. That seems like a miniscule amount of progress made across the 100 years of technology that evolved between the two.

It also seems unlikely that government intervention will mandate the phase-out of the internal combustion engine. Some assumptions could be made regarding the far-reaching economic disruptions to foreign trade markets, devastation to the economies of export countries, displaced petroleum workers, and the reallocation of every dollar generated throughout the gasoline supply chain, not to mention the economic impact to the plastics and chemical industries which rely on the waste byproducts of oil for cheap fundamental ingredients.

So, despite being a GM guy whose career was built on gas engine emissions and combustion technology, I must admit that I had been rooting for Elon Musk’s solar-powered auto revolution.  Mostly because, I hoped to avoid becoming one of those cynical old guys who fights progress, for no reason other than, maintaining a comfortable status-quo.

I am still optimistic that electric powertrains will become mainstream and that automobiles will convert to solar charged electricity before the rest of the power grid. However, I am imagining that the solar revolution will plod forward slowly for decades in a long-drawn-out guerilla war due to the lack of strong market pull for those alternative fuel vehicles while the petroleum industry survives long enough to support the codependent  plastics industry until renewable sourced manufacturing ingredients are developed.

Hopefully Tesla investors are long-range thinkers and have prepared for the long road ahead when consumer demand someday aligns with electric automobile technology. Recently Tesla’s investors had their confidence shaken when company stock prices dropped over 60% during the first week of April over a combination of news that was only slightly negative. If that bearish responsiveness is any indicator of the market, we could expect that a prolonged loss of investor confidence could snuff out the young company before they make it to the finish line.

Few people in the auto industry expect the Tesla plants to disappear or its existing cars to become obsolete. However, a sharp drop in Tesla market value will most likely lure General Motors or Toyota in to absorb the brand at a bargain price in the coming years. Unfortunately, if that happens, a Tesla surviving without Musk at the helm will probably see electric car technology being pushed to the back burner, adding several additional decades to reach full market potential.

It is times such as this that it becomes apparent that consumers (and voters) stated principals fail to correlate with their actions. This anomaly of consumer behavior manages to slow the adoption of superior technology for reasons that will remain a mystery.

My personal experience from being on the front lines, trying to persuade General Motors customers to buy the hybrid powertrain has burned this demand paradox into my view of most technological advances.

For now, we can appreciate how one man, Elon Musk, passionate about his vision for solar power has managed to get far enough to pose a serious market threat to all three economic super powers: auto manufacturing, petroleum and the global power grid. I tip my GM hat to the relentless visionary and hope he makes it to the finish line to prove the naysayers wrong.

tesla

As a matter of fact, back in 2012, I used to tell a similar story to this one about rates of technology adoption, it was my own story about the technology predictions of a decade earlier. In 2002, a full two years before Elon Musk joined Tesla, while he was busy building PayPal, I enrolled in an Automotive Technology program and was introduced to Professors suggesting that our class focus on the General Motors hybrid trucks and Chevrolet EV1 electric prototypes from the parking lot, since they would be the products in the market when we finished the program in 2005.

Not taking any credit away from the Tesla contributions, but electric and hybrid gas/electric models were well-developed by several large automakers and proven in field testing long prior to 2002. General Motors introduced the GM Impact electric car prototype in 1990 and revised it several times into the EV1 in 1996, adding the S10 EV truck in 1997, the duo sold around 1600 units from 1996 through 2002 when they were discontinued due to high replacement battery costs.

GM prepared the next generation of alternative fuel powertrains, this time using smaller batteries in combination with the standard gas engine, allowing drivers to select between gas and electric modes. The added value proposition to hybrid technology being that the hybrid optioned car could still be driven in standard gasoline mode if the customer chose not to spend the $10,000 plus to replace the batteries required for the electric mode.

In 2002, most of us in the GM world thought this hybrid technology would provide the company with the competitive edge needed to fend off the Japanese competitors in the global market. Inside GM, everyone seemed fully committed to the project and the service press even printed the repair manuals and training materials for an expected hybrid truck product release.

We were told that the first hybrids would release no later than 2005. Surprisingly though, with the exception of the quiet release of a small batch of hybrid tucks in 2005, General Motors delayed the marketing air campaign for hybrid offerings until 2009. The marketing launch failed to build the required buzz among consumers and even with $4 gas, the hybrids were seen by most as a dismal market flop. Some environmental critics claim that the marketing campaign was designed to flop with a hope of preserving GM’s previous investments in gas engine technology while also winning support of environmentally focused politicians.

Regardless of the motives of the ineffective marketing campaign, I was there when new customers came to our showrooms to test drive hybrid models, then agreed with the proposition of the revolutionary technology; but, when it came time to sign the finance contracts, the agreement fizzled out. Many of these deals fell apart in the finance office, when the customers began contemplating uncertain future repair costs, trade in values, warranty extensions and differences in insurance rates. It seemed like many feared that hybrids would be a passing fad and they could be stuck investing in a car that would have limited resale or trade in value.

In fact, from 2008 to 2018 the General Motors dealership I worked at sold around 8000 new vehicles and despite the huge bonus offered to sales staff and managers to improve sales of hybrids, the store sold a whopping total of sixteen hybrid cars in those nine years and nearly all of those were leases.

These thoughts came to mind earlier this week when having a conversation with friends about another ambitious prediction in tech news that, by 2020, over 90% of web traffic will be video rather than the text and image data of today.

Being jaded now by these types of predictions, I shared with them another related story, that just a couple of years earlier I had read a similarly optimistic prediction, that by 2020, few people would be texting and reading from their phones; instead, we would all be using Siri-like voice translators and listening to the replies of others through our cordless ear buds.

With the 2020 model year now only fifteen short months away, I realize that most of the auto manufacturing line equipment is currently tooling for that year’s production and my friends in engineering tell me that they are working from forecasts that fewer than 7% of GM vehicles sold in 2020 will be ordered with the hybrid powertrains.

With that fresh on my mind, I am sitting in the atrium lounge of the University of South Florida, surrounded by nearly a hundred of the youngest millennials and realized that they were all still texting from their phones and reading the responses. I will curb my enthusiasm for consumer technology adoption projections in the future…..  I am starting to see how old guys become so cynical


The foundation article from back in 2012, here is the research  on the state of fuel economy technology and the obstacles to adoption:

Continued Consumer Resistance to General Motors Hybrid Vehicle Technology  – November 7, 2012

EPA policies that affect the economy become front page news in an election year and the hot topic for 2012 is the Corporate Average Fuel Economy (CAFE) revisions, requiring automakers to improve average automobile fuel economy from 29 mpg to 54.5 mpg over the next 13 years. Agreements to these revised fuel efficiency standards were concessions made by automakers during the industry bailouts of 2009.

In the backlash of that federal bailout, critics have been quick to fault American manufacturers for their lack of long-term planning. However, in defense of management strategy, the automakers have for decades been doing what profitable businesses do best, responding to consumer demand (Vlasic).

The press often suggests that domestic auto sales recovery will depend on the fuel economy of the products that manufacturers can provide. These critics assume that consumers make purchase decisions using primarily math and logic; but, those of us in the auto industry experience firsthand that purchase motives are more akin to purchasing fashions or artwork. To most Americans, their car is a part of their self-image, not just a tool that converts dollars into miles traveled.

Journalists such as News-Herald’s John Lasko write articles that with opening lines such as, “With gas prices hovering near $4 a gallon, many are opting to trade in their gas-guzzlers for more fuel-efficient vehicles.” With news headlines like those, it is easy for the public to conclude that the US automakers lack of sales was due to its heavy reliance on gas guzzling models. However, those assumptions are based on popular ideas that the domestic manufacturers previously lacked the capability to produce fuel-efficient vehicles. In their defense, the simple reality remains, the automakers must make their first priority to produce those vehicles that sell well in the domestic market.

The critics overlook the 3 million Chevrolet Chevettes that were produced between 1976 and 1987 or its domestic counterparts, the Plymouth Horizon and the Ford Fiesta that provided fuel efficiency equal to most economy cars on the market today. For example, the Chevrolet Chevette was for nearly a decade, the American flagship economy car, selling millions by providing a real world fuel economy of 25 city/ 30 hwy, or with a popular diesel engine option reaching 33 city/41 hwy. The Chevette was sold with a base price, that inflation adjusts to about $11,000 in today’s dollars and consistently surpassed the fuel economy ratings of it’s main Japanese competitor, the Toyota Corolla by nearly 2 mpg for nearly a decade (fueleconomy.gov).

Compare those cost and fuel efficiency ratings to today’s most economical products available in the US, the Korean made 2013 Hyundai Accent with an MSRP of $10,665 that is rated at 29 city/39 hwy. The comparison of these cars in the context of the 25 years of technology that evolved between them should dispel assumptions that Asian economy cars have enjoyed decades of superiority in fuel economy (fueleconomy.gov). However, in the American car market, every one of those fuel sipping economy cars was discontinued in the late 1980’s when sales dried up as the pendulum of automobile fashion swung toward a return of larger and more powerful transportation, with the introduction Sport Utility vehicles and the return of V8 powered high performance sedans.

By 1990, it became increasingly unfashionable to be seen in fuel-efficient cars, American auto style entered the age of the 1993 Jeep Grand Cherokee, offering a taller ride height for a better visibility in traffic and providing the owner with a sense of safety and rugged capability. The Grand Cherokee became the benchmark to measure style popularity, marketed with an image of recreational outdoor travel and adventure rather than previous trend for economical commuter transport. These mid-sized all terrain Sport Utilities grew especially popular with female buyers in northern states, at the same time four-door 4×4 pickups became increasingly popular with young male buyers seeking that “Eddie Bauer” outdoorsy image.

Critics often ignore the strategic decisions that allocated research and development funding away from fuel economy and directed budgets to safety, performance and durability to meet the consumer demand curves. Over the past 15 years the average vehicle age alone has grown by a third to 10.8 years old with advancements in vehicle durability (USA Today). Additional progress that was made during that period to improve braking distances and implement crash avoidance technology reduced accident frequency and cut the percentage of crash fatalities in half. In an effort to appeal to consumer demands for more powerful accelerator pedals, 0-60 acceleration times have improved by over 40%. And to counter the reliability critics of the domestic cars from the 1980’s, the inflation adjusted annual maintenance costs have dropped by more than 80% (NADA.COM).

Today even after the industry collapse, American manufacturers once again dominate automobile industry technology development, General Motors again was ranked the 2011 No. 1 innovator in automotive patents by US patent board (Tuttle). However, consumer demand trends in automobiles are similar to those in fashion, with opposing trends recurring in 10-year cycles, such as style trends toward skinny jeans from bell bottoms and short carefully styled hair to today’s bushy headed natural hairstyles. Sociologists attribute 10-year style cycles to be dependent on the needs for generational self-image, as each generation makes fashion and identity statements to differentiate them from the previous generation.

Business Times writer Brad Tuttle suggests that the fuel economy trend that began in 08 will continue to gain momentum:

“A new True Car post traces the average miles-per-gallon rise among new cars sold
in the US… all of the top seven automakers posted dramatic year over year
increases in average miles per gallon. In 2011 the average new Ford got just 17.3
mpg compared with 22 mpg in February of 2012 … the rise comes primarily as a
result of Ford doubling sales of small cars such as the Fusion and Focus”
However, despite increases in economy cars sales, auto sales as a whole have risen, the demand is also increasing on 5-year-old full size SUV’s.

According to industry writer Nick Bunkley,
“Retail prices for five-year-old full size S.U.V.’s are 23 percent higher than a year ago
according to Edmunds.com, an automotive information Website. That is more than
double the average price increase of 11 percent for all five-year-old vehicles.”
One constant in the automobile industry, vehicle selection is an emotional decision more than it is an economic one. Customer buying motives first and foremost are influenced by how the vehicle makes them feel, a vehicle becomes one with the driver, it can allow them to feel bigger, more secure or more powerful. I recently encountered a perfect case that really defined the influence of self-identity on vehicle selection.

Carolyn, a 60-year-old widow and retired guidance counselor arrived at our Buick-GMC showroom in a well maintained, three-year-old, luxury four-wheel drive truck. Carolyn had gotten a letter from our used car department that high demand for trade-ins like her truck had currently driven trade-in values up thousands over the previous year. The letter encouraged her to consider upgrading soon, to take advantage of current trade in values for used 4×4’s.

The timing of the letter was perfect for Carolyn, since she had recently moved to Florida from the Midwest and no longer had the need for wintertime four-wheel drive; to further complicate matter the garage of her new condo also couldn’t accommodate the truck. She explained when she arrived, that she really wanted to reduce her fuel budget and downsize into one the new hybrid Buick Regal sedans she had been reading about in the newspapers, rated for twice the fuel economy of her truck.

Over the following week Carolyn test drove over a dozen of fuel-efficient sedans from ours and different dealerships including the Hybrid Regal that she initially planned to purchase. Despite our best efforts to persuade her to choose our last remaining hybrid, she instead opted to buy the high performance Regal T Type, performance sedan, that ironically provides an only a slight fuel economy advantage of 15% over the truck she was trading in and was priced thousands higher than the $28,000 hybrid version.

Carol admitted that when driving the cars rated highly for fuel efficiency she felt as if she had sacrificed the power that she was accustomed to and those low powered cars made her feel old and slow behind the wheel, she insisted that she “wasn’t ready to feel like an old lady toodling down the right lane, holding up traffic”. Carol’s time behind the wheel of the Regal Turbo made her feel young and put a smile on her face every time she pushed down on the accelerator pedal. For the sake of “feeling young” she was perfectly content to pay an extra $90 in monthly car payment for the high-performance engine and luxury options and disregard the $65 month in fuel savings that the hybrid version offered.

Think of the vehicle choices by comparing it to an airplane selection; imagine choosing between airplanes, where you could select a 2 seat Cessna that might make you feel like buzzing mosquito, or for another $150 a month, you could pilot the F-16 fighter jet or a Boeing 747 to work, ….to you, which of those options excites you? The difference it capability seems huge and imagine if the difference in increased fuel costs was only an additional $100 a month. The thrill of becoming something larger and more powerful and the status that comes with that ownership has an attraction beyond what can be measured in simple terms of transportation costs per mile. American buyers have consistently demonstrated that they are willing to sacrifice a larger part of their income to enjoy vehicles that provide them with excitement.

Current sedan trends are influenced by the fuel-efficient designs from Asian manufacturers, designed to handle the high taxes on Japanese gas and the shortage of open roads and parking space on the islands of Japan. Understanding the American tastes requires us to understand the differences in our driving habits and the luxuries of smooth, open roads that Americans can enjoy, foreign drivers are often limited in their ability to appreciate American tastes for size and horsepower.

However, in Australia, with road systems similar to the US, a huge market still exists for large SUV’s, trucks and big engine cars. A market that was penetrated in the 1990’s when many Japanese automakers began to design vehicles to cater to the American influenced market, with large gas guzzlers like the Nissan Armada, Toyota Sequoia and Honda Ridgeline ensured import survival during the SUV years, and most notably even those Japanese trucks and SUV’s suffer from slightly lower fuel economy ratings than the American SUV competitors.

It has been easy for the press to fault American automakers for their lack of vision in developing economy vehicles, and to blame management for not remaining competitive in fuel efficiency technology. However, despite almost a total lack of advertising dollars for large engine SUV’s, compounded by the handicaps of stale, aged-out designs and a decrease of sales incentives offered, the demand for large SUV’s is climbing back to nearly 2008 levels despite continued fuel cost nearing $4.

Over the past 30 years American consumers have voted with their wallets, fuel economy was considerably less important to them than size, safety, reliability and performance. The challenge that lies ahead is not to build smaller, less powerful cars as much as the need to direct energy-saving technology development at the powerful SUV’s and spirited sedans that consumers demand (nada.org).

Because for many Americans the automobile is more than transportation, it is a fashion decision as much as a financial decision, and many Americans have proven for decades that are perfectly willing to pay a premium to enjoy a few more smiles-per-gallon.


Work Cited


Bunkley, Nick. “As Car Owners Downsize, the Market Is Strong for Their Used S.U.V.’s.” New

York Times. 07 2012: n. page. Web. 7 Nov. 2012.

“Side By Side Economy Comparison.” fueleconomy.gov. US Environmental Protection Agency,

07 2012. Web. 7 Nov 2012.

Lasko, John. “Gas Prices Have Car Makers, Sellers, Buyers Looking at Fuel Efficiency.” The News

Herald. 30 2012: n. page. Web. 7 Nov. 2012.

. “Guidelines.” nada.com. National Automobile Dealers Association, 07 2012. Web. 7 Nov 2012.

Tuttle, Brad. “Even with $4 Gas, Few Drivers Choose Electric Cars – Or Even Hybrids.” Business

Time. 12 2012: n. page. Web. 7 Nov. 2012.

Vlasic, Bill. “U.S. Sets Higher Fuel Efficiency Standards.” New York Times. 28 2012: n. page. Web.

7 Nov. 2012.

“Our Cars are Getting Older, too: Average Age now 10.8 years.” USA Today. 01 2012: n. page.

Web. 7 Nov. 2012.

Continued Consumer Resistance to Fuel Efficency Technologies

12/09/2012 EPA policies that affect the economy become front page news in an election year and the hot topic for 2012 is the Corporate Average Fuel Economy (CAFE) revisions, which automakers to improve average automobile fuel economy from 29 mpg to 54.5 mpg over the next 13 years. Agreements to these revised fuel efficiency standards were concessions made by automakers during the industry bailouts of 2009. In the backlash of that federal bailout, critics have been quick to fault American manufacturers for their lack of long term planning. However, in defense of management strategy, the automakers have for decades, simply been doing what profitable businesses do best, responding to consumer demand (Vlasic).

The press often suggests that domestic auto sales recovery will depend on the fuel economy of the products that manufacturers can provide. These critics assume that consumers make purchase decisions using primarily math and logic, those of us in the auto industry experience first hand purchase motives that are much more closely akin to the process of purchasing fashions or artwork. To most Americans, their car is a part of their self-image, not just a tool that converts dollars into miles traveled. Journalists such as News-Herald’s John Lasko write articles that with opening lines such as, “With gas prices hovering near $4 a gallon, many are opting to trade in their gas-guzzlers for more fuel-efficient vehicles.” With news headlines like those, it is easy for the public to conclude that the US automakers lack of sales was due to its heavy reliance on gas guzzling models. However, those assumptions are based on popular ideas that the domestic manufacturers previously lacked the capability to produce fuel efficient vehicles. In their defense, the simple reality remains, the automakers must make their first priority to produce those vehicles that sell well in the domestic market.

The critics overlook the 3 million Chevrolet Chevettes that were produced between 1976 and 1987 or its domestic counterparts, the Plymouth Horizon and the Ford Fiesta that provided fuel efficiency equal to most economy cars on the market today. For example, the Chevrolet Chevette was for nearly a decade, the American flagship economy car, selling millions by providing a real world fuel economy of 25 city/ 30 hwy, or with a popular diesel engine option reaching 33 city/41 hwy. The Chevette was sold with a base price, that inflation adjusts to about $11,000 in today’s dollars and consistently surpassed the fuel economy ratings of it’s main Japanese competitor, the Toyota Corolla by nearly 2 mpg for nearly a decade.

Compare those cost and fuel efficiency ratings to today’s most economical products available in the US, the Korean made 2013 Hyundai Accent with an MSRP of $10,665 that is rated at 29 city/39 hwy. The comparison of these cars in the context of the 25 years of technology that evolved between them should dispel assumptions that Asian economy cars have enjoyed decades of superiority in fuel economy (fueleconomy.gov). However, in the American car market, every one of those fuel sipping economy cars was discontinued in the late 1980’s when sales dried up as the pendulum of automobile fashion swung toward a return of larger and more powerful transportation, with the introduction Sport Utility vehicles and the return of V8 powered high performance sedans.

By 1990, it became increasingly uncool to be seen in fuel efficient cars, American auto fashion began to enter the age of the 1993 Jeep Grand Cherokee, offering a taller ride height for a better visibility in traffic and providing the owner with a sense of safety and rugged capability. The Grand Cherokee became the benchmark to measure style popularity, marketed with an image of recreational outdoor travel and adventure rather than previous trend for  economical commuter transport. These mid-sized all terrain Sport Utilities grew especially popular with female buyers in northern states, at the same time four door 4×4 pickups became increasingly popular with young male buyers seeking that “Eddie Bauer” outdoorsy image.

Critics often ignore the strategic decisions that allocated research and development funding away from fuel economy and directed budgets to safety, performance and durability to meet the consumer demand curves. Over the past 15 years the average vehicle age alone has grown by a third to 10.8 years old with advancements in vehicle durability (USA Today).  Additional progress that was made during that period to improve braking distances and implement crash avoidance technology reduced accident frequency and cut the percentage of crash fatalities in half.  In an effort to appeal to consumer demands for more powerful accelerator pedals, 0-60 acceleration times have improved by over 40%. And to counter the reliability critics of the domestic cars from the 1980’s, the inflation adjusted annual maintenance costs have dropped by more than 80% (NADA.COM).

Today even after the industry collapse, American manufacturers once again dominate automobile industry technology development, General Motors again was ranked the 2011 No. 1 innovator in automotive patents by US patent board (Tuttle). However, consumer demand trends in automobiles are similar to those in fashion, with opposing trends recurring in 10 year cycles, such as style trends toward skinny jeans from bell bottoms and short carefully styled hair to today’s bushy headed natural hairstyles. Sociologists attribute 10 year style cycles to be dependent on the needs for generational self-image, as each generation makes fashion and identity statements to differentiate them from the previous generation.

Business Times writer Brad Tuttle suggests that the fuel economy trend that began in 08 will continue to gain momentum:

“A new True Car post traces the average miles-per-gallon rise among new cars sold

in the US… all of the top seven automakers posted dramatic year over year

increases in average miles per gallon. In 2011 the average new Ford got just 17.3

mpg compared with 22 mpg in February of 2012 … the rise comes primarily as a

result of Ford doubling sales of small cars such as the Fusion and Focus”

However, despite increases in economy cars sales, auto sales as a whole have risen, the demand is also increasing on 5 year old full size SUV’s. According to industry writer Nick Bunkley,

“Retail prices for five-year-old full size S.U.V.’s are 23 percent higher than a year ago

according to Edmunds.com, an automotive information Web Site. That is more than

double the average price increase of 11 percent for all five-year-old vehicles.”

One thing is constant in the automobile industry, vehicle selection is an emotional decision more than it is an economic one. Customer buying motives first and foremost are influenced by how the vehicle makes them feel, a vehicle becomes one with the driver, it can allow them to feel bigger, more secure or more powerful.  I recently encountered a perfect case that really defined the influence of self-identity on vehicle selection.

Carolyn, a 60 year old widow and retired guidance counselor arrived at our Buick-GMC showroom in a well maintained, three year-old, luxury four wheel drive truck. Carolyn had gotten a letter from our used car department that high demand for trade-ins like her truck had currently driven trade-in values up thousands over the previous year. The letter encouraged her to consider upgrading soon, to take advantage of current trade in values for used 4×4’s.

The timing of the letter was perfect for Carolyn, since she had recently moved to Florida from the Midwest and no longer had the need for wintertime four wheel drive; to further complicate matter the garage of her new condo also couldn’t accommodate the truck. She explained when she arrived, that she really wanted to reduce her fuel budget and downsize into one the new hybrid Buick Regal sedans she had been reading about in the newspapers, rated for twice the fuel economy of her truck.

Over the following week Carolyn test drove over a dozen of fuel efficient sedans from ours and different dealerships including the Hybrid Regal that she initially planned to purchase. Despite our best efforts to persuade her to choose our last remaining hybrid, she instead opted to buy the high performance Regal T Type, performance sedan, that ironically provides a only a slight fuel economy advantage of 15% over the truck she was trading in and was priced thousands higher than the $28,000 hybrid version.

Carol admitted that when driving the cars rated highly for fuel efficiency she felt as if she had sacrificed the power that she was accustomed to and those low powered cars made her feel old and slow behind the wheel, she insisted that she “wasn’t ready to feel like an old lady toodling down the right lane, holding up traffic”. Carol’s time behind the wheel of the Regal Turbo made her feel young and put a smile on her face every time she pushed down on the accelerator pedal. For the sake of “feeling young” she was perfectly content to pay an extra $90 in monthly car payment for the high performance engine and luxury options and also disregard the $65 month in fuel savings that the hybrid version offered.

Think of the vehicle choices by comparing it to an airplane selection; imagine choosing between airplanes, where you could select a 2 seat Cessna that might make you feel like buzzing mosquito, or for another $150 a month you could pilot the F-16 fighter jet or a Boeing 747 to work, ….to you which of those options excites you?. The difference it capability seems huge and the difference in increased fuel costs may only be an additional $100 a month. The thrill of becoming something larger and more powerful and the status that comes with that ownership has an attraction beyond what can be measured in simple terms of transportation costs per mile. American buyers have consistently demonstrated that they are willing to sacrifice a larger part of their income to enjoy vehicles that provide them with excitement.

Current sedan trends are being influenced by the fuel efficient designs from Asian manufacturers that were designed to handle the high taxes on Japanese gas and the shortage of open roads on the islands of Japan. Understanding the American tastes requires us to understand the differences in our driving habits, many countries do not have the smooth open roads that American can enjoy, foreign drivers are often limted in their ability to appreciate American tastes for size and horsepower. However in Australia, which has road systems similar to the US, they have a huge market for large SUV’s, trucks and big engined cars. During the 1990’s many Japanese automakers began to design vehicles to cater to the American market, large gas guzzlers like the Nissan Armada, Toyota Sequoia and Honda Ridgeline ensured import survival during the SUV years, and most notably those Japanese trucks and SUV’s suffer from slightly lower fuel economy ratings than the American SUV competitors.

It has been easy for the press to fault American automakers for their lack of vision in developing economy vehicles, and to blame management for not remaining competitive in fuel efficiency technology. However, despite almost a total lack of advertising dollars for large engine SUV’s, compounded by the handicaps of stale aged out designs and a decrease of discounts offered on the large SUVs, the demand for large SUV’s is climbing back to nearly 2008 levels despite continued fuel cost nearing $4.

Over the past 30 years, American consumers have voted with their wallets, which indicated that fuel economy has been considerably less important than size, safety, reliability and performance. The challenges that lie ahead are not building smaller, less powerful cars as much as directing energy saving technology development at the powerful SUV’s, light trucks and spirited sedans that American consumers demand.

Because for many Americans the automobile is more than simple transportation, it is as much an entertainment and fashion decision as a financial decision, and many of those Americans have proven for decades that they are perfectly willing to pay a premium to enjoy a few more smiles-per-gallon.

Work Cited

Bunkley, Nick. “As Car Owners Downsize, the Market Is Strong for Their Used S.U.V.’s.” New

                        York Times. 07 2012: n. page. Web. 7 Nov. 2012.

“Side By Side Economy Comparison.” fueleconomy.gov. US Environmental Protection Agency,

07 2012. Web. 7 Nov 2012.

Lasko, John. “Gas Prices Have Car Makers, Sellers, Buyers Looking at Fuel Efficiency.” The News

                       Herald. 30 2012: n. page. Web. 7 Nov. 2012.

. “Guidelines.” nada.com. National Automobile Dealers Association, 07 2012. Web. 7 Nov 2012.

Tuttle, Brad. “Even with $4 Gas, Few Drivers Choose Electric Cars – Or Even Hybrids.” Business

                          Time. 12 2012: n. page. Web. 7 Nov. 2012.

Vlasic, Bill. “U.S. Sets Higher Fuel Efficiency Standards.” New York Times. 28 2012: n. page. Web.

7 Nov. 2012.

“Our Cars are Getting Older, too: Average Age now 10.8 years.” USA Today. 01 2012: n. page.

Web. 7 Nov. 2012..